APC 2006 Annual Report Download - page 117
Download and view the complete annual report
Please find page 117 of the 2006 APC annual report below. You can navigate through the pages in the report by either clicking on the pages listed below, or by using the keyword search tool below to find specific information within the annual report.-
 1
1 -
2
-
3
-
4
-
5
-
6
-
7
-
8
-
9
-
10
-
11
-
12
-
13
-
14
-
15
-
16
-
17
-
18
-
19
-
20
-
21
-
22
-
23
-
24
-
25
-
26
-
27
-
28
-
29
-
30
-
31
-
32
-
33
-
34
-
35
-
36
-
37
-
38
-
39
-
40
-
41
-
42
-
43
-
44
-
45
-
46
-
47
-
48
-
49
-
50
-
51
-
52
-
53
-
54
-
55
-
56
-
57
-
58
-
59
-
60
-
61
-
62
-
63
-
64
-
65
-
66
-
67
-
68
-
69
-
70
-
71
-
72
-
73
-
74
-
75
-
76
-
77
-
78
-
79
-
80
-
81
-
82
-
83
-
84
-
85
-
86
-
87
-
88
-
89
-
90
-
91
-
92
-
93
-
94
-
95
-
96
-
97
-
98
-
99
-
100
-
101
-
102
-
103
-
104
-
105
-
106
-
 107
107 -
 108
108 -
 109
109 -
 110
110 -
 111
111 -
 112
112 -
 113
113 -
 114
114 -
 115
115 -
 116
116 -
 117
117 -
 118
118 -
 119
119 -
 120
120 -
 121
121 -
 122
122 -
 123
123 -
 124
124 -
 125
125 -
 126
126 -
 127
127 -
128
-
129
-
130
-
131
-
132
-
133
-
134
-
135
-
136
-
137
-
138
-
139
-
140
-
141
-
142
-
143
-
144
-
145
-
146
-
147
-
148
-
149
-
150
-
151
-
152
-
153
-
154
-
155
-
156
-
157
-
158
-
159
-
160
-
161
-
162
-
163
-
164
-
165
-
166
-
167
-
168
-
169
-
170
-
171
-
172
-
173
-
174
-
175
-
176
-
177
-
178
-
179
-
180
-
181
-
182
-
183
-
184
-
185
-
186
-
187
-
188
-
189
-
190
-
191
-
192
-
193
-
194
-
195
-
196
 |
 |
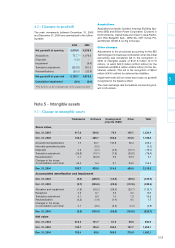
115
5
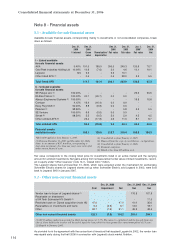
8.3 - Current financial assets
Dec. 31, 2006
Short-term investments (1) 48.2
Pension assets (2) 25.3
Total current financial assets 73.5
(1) These investments were previously classifed under
"Available-for-sale financial assets" - see note 8.1.
(2) These assets were previously classified under "Other
receivables" - see note 11.
Substantially all pension assets concern plans in the
United States which had a surplus at December 31,
2006 (note 15).
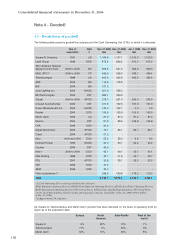
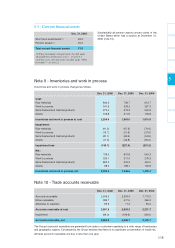
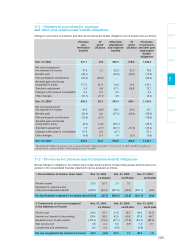
Note 9 - Inventories and work in process
Inventories and work in process changed as follows:
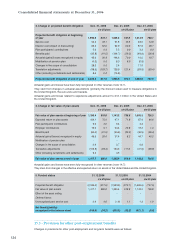
Note 10 - Trade accounts receivable
Dec. 31, 2006 Dec. 31, 2005 Dec. 31, 2004
Cost:
Raw materials 830.6 739.7 613.7
Work in process 341.8 333.2 297.3
Semi-finished and finished products 973.4 579.2 504.8
Goods 109.8 211.9 194.8
Inventories and work in process at cost 2,255.6 1,864.0 1,610.6
Impairment:
Raw materials (91.3) (97.9) (70.4)
Work in process (15.7) (21.8) (21.0)
Semi-finished and finished products (81.1) (63.9) (54.8)
Goods (11.6) (43.8) (55.0)
Impairment loss (199.7) (227.4) (201.2)
Net :
Raw materials 739.3 641.8 543.3
Work in process 326.1 311.4 276.3
Semi-finished and finished products 892.3 515.3 450.0
Goods 98.2 168.1 139.8
Inventories and work in process, net 2,055.9 1,636.6 1,409.4
Dec. 31, 2006 Dec. 31, 2005 Dec. 31, 2004
Accounts receivable 2,509.2 2,204.4 1,772.5
Notes receivable 386.7 417.5 396.2
Advances to suppliers 85.9 71.4 63.0
Accounts receivable at cost 2,981.8 2,693.3 2,231.7
Impairment (99.0) (106.6) (96.0)
Accounts receivable, net 2,882.8 2,586.7 2,135.7
The Group’s accounts receivable are generated from sales to customers operating in a wide range of businesses
and geographic regions. Consequently, the Group believes that there is no significant concentration of credit risk.
All trade accounts receivable are due in less than one year.