APC 2006 Annual Report Download - page 173
Download and view the complete annual report
Please find page 173 of the 2006 APC annual report below. You can navigate through the pages in the report by either clicking on the pages listed below, or by using the keyword search tool below to find specific information within the annual report.-
 1
1 -
2
-
3
-
4
-
5
-
6
-
7
-
8
-
9
-
10
-
11
-
12
-
13
-
14
-
15
-
16
-
17
-
18
-
19
-
20
-
21
-
22
-
23
-
24
-
25
-
26
-
27
-
28
-
29
-
30
-
31
-
32
-
33
-
34
-
35
-
36
-
37
-
38
-
39
-
40
-
41
-
42
-
43
-
44
-
45
-
46
-
47
-
48
-
49
-
50
-
51
-
52
-
53
-
54
-
55
-
56
-
57
-
58
-
59
-
60
-
61
-
62
-
63
-
64
-
65
-
66
-
67
-
68
-
69
-
70
-
71
-
72
-
73
-
74
-
75
-
76
-
77
-
78
-
79
-
80
-
81
-
82
-
83
-
84
-
85
-
86
-
87
-
88
-
89
-
90
-
91
-
92
-
93
-
94
-
95
-
96
-
97
-
98
-
99
-
100
-
101
-
102
-
103
-
104
-
105
-
106
-
107
-
108
-
109
-
110
-
111
-
112
-
113
-
114
-
115
-
116
-
117
-
118
-
119
-
120
-
121
-
122
-
123
-
124
-
125
-
126
-
127
-
128
-
129
-
130
-
131
-
132
-
133
-
134
-
135
-
136
-
137
-
138
-
139
-
140
-
141
-
142
-
143
-
144
-
145
-
146
-
147
-
148
-
149
-
150
-
151
-
152
-
153
-
154
-
155
-
156
-
157
-
158
-
159
-
160
-
161
-
162
-
 163
163 -
 164
164 -
 165
165 -
 166
166 -
 167
167 -
 168
168 -
 169
169 -
 170
170 -
 171
171 -
 172
172 -
 173
173 -
 174
174 -
 175
175 -
 176
176 -
 177
177 -
 178
178 -
 179
179 -
 180
180 -
 181
181 -
 182
182 -
 183
183 -
184
-
185
-
186
-
187
-
188
-
189
-
190
-
191
-
192
-
193
-
194
-
195
-
196
 |
 |

7
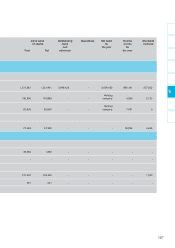
2.2 - Unaudited condensed combined balance sheet
Year ended December 31, 2006
ASSETS Schneider APC APC APC Schneider
Electric US GAAP adjustments IFRS Electric
IFRS unaudited US GAAP unaudited + APC
to IFRS IFRS
(in millions of euros)
unaudited unaudited
Non-current assets:
Goodwill, net 6,185.7 14.0 - 14.0 6,199.7
Intangible assets, net 1,493.1 15.6 - 15.6 1,508.7
Property, plant and equipment, net 1,615.1 157.9 - 157.9 1,773.0
Assets held for sale 6.4 - - - 6.4
Total tangible and intangible assets 3,114.6 173.5 - 173.5 3,288.1
Investments in associates 10.2 - - - 10.2
Available-for-sale financial assets 315.7 0.2 - 0.2 315.9
Other financial assets 114.2 3.7 - 3.7 117.9
Total non-current financial assets 429.9 3.9 - 3.9 433.8
Deferred tax assets 672.8 87.9 - 87.9 760.7
Total non-current assets 10,413.2 279.3 - 279.3 10,692.5
Current assets:
Inventories and work in process 2,055.9 451.0 - 451.0 2,506.9
Trade accounts receivable 2,882.8 326.9 - 326.9 3,209.7
Other receivables and prepaid expenses 994.8 85.4 - 85.4 1,080.2
Current financial assets 73.5 270.2 - 270.2 343.7
Cash and cash equivalents 2,544.1 183.7 - 183.7 2,727.8
Total current assets 8,551.1 1,317.2 - 1,317.2 9,868.3
Total assets 18,964.3 1,596.5 - 1,596.5 20,560.8
171