APC 2006 Annual Report Download - page 65
Download and view the complete annual report
Please find page 65 of the 2006 APC annual report below. You can navigate through the pages in the report by either clicking on the pages listed below, or by using the keyword search tool below to find specific information within the annual report.-
 1
1 -
2
-
3
-
4
-
5
-
6
-
7
-
8
-
9
-
10
-
11
-
12
-
13
-
14
-
15
-
16
-
17
-
18
-
19
-
20
-
21
-
22
-
23
-
24
-
25
-
26
-
27
-
28
-
29
-
30
-
31
-
32
-
33
-
34
-
35
-
36
-
37
-
38
-
39
-
40
-
41
-
42
-
43
-
44
-
45
-
46
-
47
-
48
-
49
-
50
-
51
-
52
-
53
-
54
-
 55
55 -
 56
56 -
 57
57 -
 58
58 -
 59
59 -
 60
60 -
 61
61 -
 62
62 -
 63
63 -
 64
64 -
 65
65 -
 66
66 -
 67
67 -
 68
68 -
 69
69 -
 70
70 -
 71
71 -
 72
72 -
 73
73 -
 74
74 -
 75
75 -
76
-
77
-
78
-
79
-
80
-
81
-
82
-
83
-
84
-
85
-
86
-
87
-
88
-
89
-
90
-
91
-
92
-
93
-
94
-
95
-
96
-
97
-
98
-
99
-
100
-
101
-
102
-
103
-
104
-
105
-
106
-
107
-
108
-
109
-
110
-
111
-
112
-
113
-
114
-
115
-
116
-
117
-
118
-
119
-
120
-
121
-
122
-
123
-
124
-
125
-
126
-
127
-
128
-
129
-
130
-
131
-
132
-
133
-
134
-
135
-
136
-
137
-
138
-
139
-
140
-
141
-
142
-
143
-
144
-
145
-
146
-
147
-
148
-
149
-
150
-
151
-
152
-
153
-
154
-
155
-
156
-
157
-
158
-
159
-
160
-
161
-
162
-
163
-
164
-
165
-
166
-
167
-
168
-
169
-
170
-
171
-
172
-
173
-
174
-
175
-
176
-
177
-
178
-
179
-
180
-
181
-
182
-
183
-
184
-
185
-
186
-
187
-
188
-
189
-
190
-
191
-
192
-
193
-
194
-
195
-
196
 |
 |
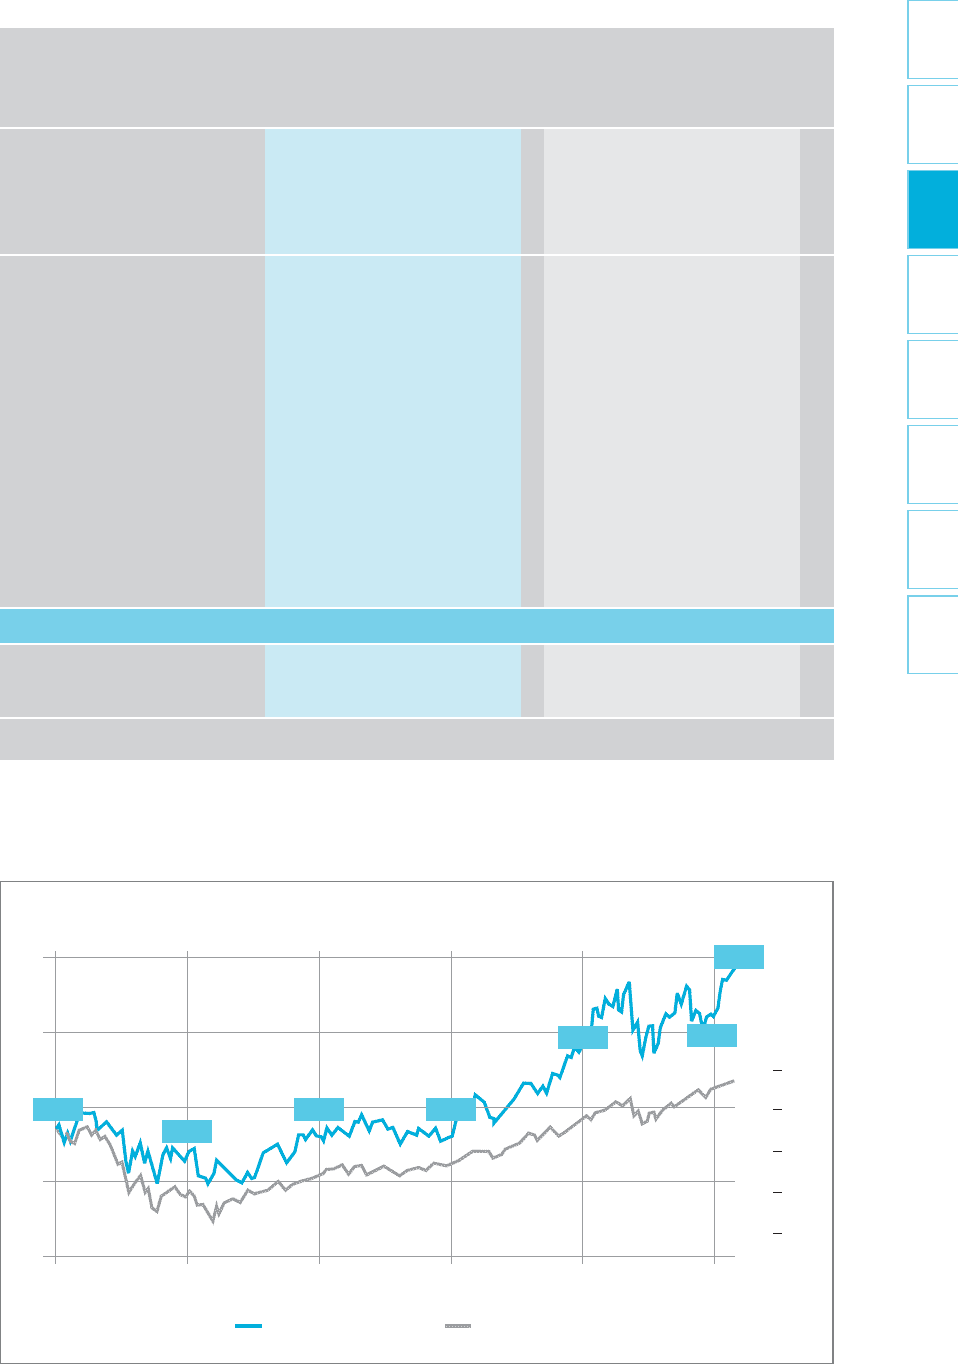
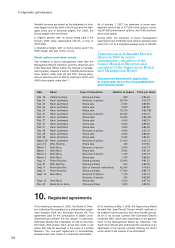
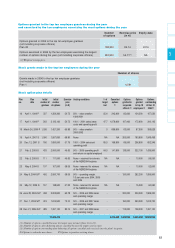
18-Month Trading Data
Year Month Trading Value Price
volume (in millions (in euros) (1)
(in thousands of euros)
of shares) High Low
2005 September 17,532 1,124.51 65.80 62.25
October 22,359 1,526.80 69.90 65.50
November 16,298 1,169.77 74.00 68.40
December 15,252 1,140.87 77.15 72.75
2006 January 20,947 1,682.25 87.50 75.05
February 18,948 1,609.60 87.35 82.10
March 20,506 1,775.79 89.80 83.55
April 18,199 1,610,90 92.05 84.05
May 36,779 3,178.99 93.40 77.25
June 23,684 1,826.62 83.70 70.85
July 17,390 1,349.18 82.00 72.80
August 15,596 1,287.73 85.50 79.35
September 17,821 1,535.55 90.75 82.95
October 28,518 2,501.32 93.35 81.35
November 30,241 2,522.78 87.10 78.45
December 21,376 1,775.16 85.25 79.80
Total 2006 270,005 22,655.87
2007 January 32,657 2,940.66 94.85 84.40
February 26,628 2,515.83 97.70 90.00
(1) During the trading session.
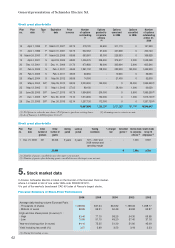
The Schneider Electric SA share vs. the CAC 40 index over 5 years
(Thomson Financial data)
Schneider Electric
share
6,000
5,000
4,000
3,000
2,000
CAC 40
Index
20
40
60
80
100
Dec. 31,
2001
Dec. 31,
2002
Dec. 31,
2003
Dec. 31,
2004
Dec. 31,
2005
Dec. 31,
2006
Feb. 22,
2007
n Share price in euros Schneider Electric share CAC 40 index (base: Schneider Electric
on December 31, 2000)
54.00
45.09
51.90 51.20
75.35 84.10
97.05
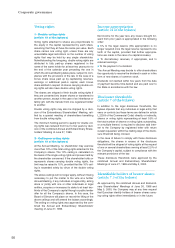
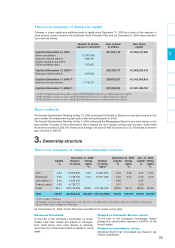
Monep
Options on Schneider Electric SA shares have been traded on the MONEP market since December 20, 1996.
63
3