APC 2006 Annual Report Download - page 134
Download and view the complete annual report
Please find page 134 of the 2006 APC annual report below. You can navigate through the pages in the report by either clicking on the pages listed below, or by using the keyword search tool below to find specific information within the annual report.-
 1
1 -
2
-
3
-
4
-
5
-
6
-
7
-
8
-
9
-
10
-
11
-
12
-
13
-
14
-
15
-
16
-
17
-
18
-
19
-
20
-
21
-
22
-
23
-
24
-
25
-
26
-
27
-
28
-
29
-
30
-
31
-
32
-
33
-
34
-
35
-
36
-
37
-
38
-
39
-
40
-
41
-
42
-
43
-
44
-
45
-
46
-
47
-
48
-
49
-
50
-
51
-
52
-
53
-
54
-
55
-
56
-
57
-
58
-
59
-
60
-
61
-
62
-
63
-
64
-
65
-
66
-
67
-
68
-
69
-
70
-
71
-
72
-
73
-
74
-
75
-
76
-
77
-
78
-
79
-
80
-
81
-
82
-
83
-
84
-
85
-
86
-
87
-
88
-
89
-
90
-
91
-
92
-
93
-
94
-
95
-
96
-
97
-
98
-
99
-
100
-
101
-
102
-
103
-
104
-
105
-
106
-
107
-
108
-
109
-
110
-
111
-
112
-
113
-
114
-
115
-
116
-
117
-
118
-
119
-
120
-
121
-
122
-
123
-
 124
124 -
 125
125 -
 126
126 -
 127
127 -
 128
128 -
 129
129 -
 130
130 -
 131
131 -
 132
132 -
 133
133 -
 134
134 -
 135
135 -
 136
136 -
 137
137 -
 138
138 -
 139
139 -
 140
140 -
 141
141 -
 142
142 -
 143
143 -
 144
144 -
145
-
146
-
147
-
148
-
149
-
150
-
151
-
152
-
153
-
154
-
155
-
156
-
157
-
158
-
159
-
160
-
161
-
162
-
163
-
164
-
165
-
166
-
167
-
168
-
169
-
170
-
171
-
172
-
173
-
174
-
175
-
176
-
177
-
178
-
179
-
180
-
181
-
182
-
183
-
184
-
185
-
186
-
187
-
188
-
189
-
190
-
191
-
192
-
193
-
194
-
195
-
196
 |
 |

Note 23 - Research and development
Research and development costs break down as follows:
2006 2005 2004
Research and development costs recognized as an expense (1) 491.6 433.2 489.0
Capitalized development costs (2) 132.4 108.9 46.0
Total research and development costs of the year 624.0 542.1 535.0
(1)
Of which €149.4 million recognized in cost of good sold, €14.6 million in commercial costs and €327.6 million in R&D costs.
(2) Of which €11.6 million recognized in software.
Amortization of capitalized development costs came to 23.0 million in 2006 and 8.5 million in 2005. In addi-
tion, impairment losses of 5.0 million were recorded on capitalized development costs in 2006.
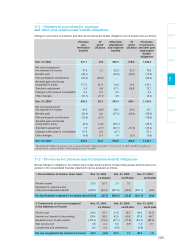
Note 24 - Depreciation, amortization and provision expense
Depreciation, amortization and provision expenses recognized in operating expenses were as follows:
2006 2005 2004
Included in cost of sales:
Depreciation and amortization (254.0) (234.7) (231.0)
Provisions (10.8) (29.5) (21.5)
Included in selling, general and administrative expenses:
Depreciation and amortization (138.5) (133.4) (131.4)
Provisions (20.5) 28.2 28.5
Depreciation, amortization and provision expense (423.8) (369.4) (355.4)
In 2006, provisions in an amount of 49.4 million were recorded in other operating income/(expense) (note 25)
and impairment of other non-current assets represented a charge of 32.2 million.
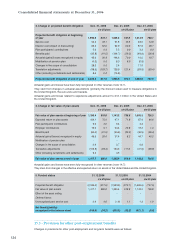
Note 25 - Other operating income and expenses
Other operating income and expenses break down as follows:
2006 2005 2004
Restructuring (80.7) (96.9) (88.0)
Impairment losses on property,
plant and equipment and intangible assets (35.2) (10.1) -
Impairment losses on goodwill (0.2) (8.4) -
Gains on asset disposals 45.6 13.3 14.5
Losses on asset disposals (including scrapped assets) (7.5) (9.8) (5.6)
Other (38.0) 8.7 38.4
Other operating income and expenses (116.0) (103.2) (40.7)
I
n 2006, the Group realized capital gains on sales of property assets, including the sale of the historical
Telemecanique site in the Paris area.
Operating profit includes 115.9 million in non-recurring expenses related to asset impairment (35.2 million)
and restructuring programs (80.7 million).
Non-recurring expenses primarily stemmed from the reorganization of the Building Automation business in
Europe, for 16 million, continued industrial reorganization in the Group's core businesses in Europe (France, the
UK and Italy), for 67 million, and reorganization of operations in Australia for 7 million.
In addition, provisions of 38 million were set aside to cover costs arising from certain delays and problems in
bringing new information systems on stream (in "other" above).
Consolidated financial statements at December 31, 2006
132