APC 2006 Annual Report Download - page 156
Download and view the complete annual report
Please find page 156 of the 2006 APC annual report below. You can navigate through the pages in the report by either clicking on the pages listed below, or by using the keyword search tool below to find specific information within the annual report.-
 1
1 -
2
-
3
-
4
-
5
-
6
-
7
-
8
-
9
-
10
-
11
-
12
-
13
-
14
-
15
-
16
-
17
-
18
-
19
-
20
-
21
-
22
-
23
-
24
-
25
-
26
-
27
-
28
-
29
-
30
-
31
-
32
-
33
-
34
-
35
-
36
-
37
-
38
-
39
-
40
-
41
-
42
-
43
-
44
-
45
-
46
-
47
-
48
-
49
-
50
-
51
-
52
-
53
-
54
-
55
-
56
-
57
-
58
-
59
-
60
-
61
-
62
-
63
-
64
-
65
-
66
-
67
-
68
-
69
-
70
-
71
-
72
-
73
-
74
-
75
-
76
-
77
-
78
-
79
-
80
-
81
-
82
-
83
-
84
-
85
-
86
-
87
-
88
-
89
-
90
-
91
-
92
-
93
-
94
-
95
-
96
-
97
-
98
-
99
-
100
-
101
-
102
-
103
-
104
-
105
-
106
-
107
-
108
-
109
-
110
-
111
-
112
-
113
-
114
-
115
-
116
-
117
-
118
-
119
-
120
-
121
-
122
-
123
-
124
-
125
-
126
-
127
-
128
-
129
-
130
-
131
-
132
-
133
-
134
-
135
-
136
-
137
-
138
-
139
-
140
-
141
-
142
-
143
-
144
-
145
-
 146
146 -
 147
147 -
 148
148 -
 149
149 -
 150
150 -
 151
151 -
 152
152 -
 153
153 -
 154
154 -
 155
155 -
 156
156 -
 157
157 -
 158
158 -
 159
159 -
 160
160 -
 161
161 -
 162
162 -
 163
163 -
 164
164 -
 165
165 -
 166
166 -
167
-
168
-
169
-
170
-
171
-
172
-
173
-
174
-
175
-
176
-
177
-
178
-
179
-
180
-
181
-
182
-
183
-
184
-
185
-
186
-
187
-
188
-
189
-
190
-
191
-
192
-
193
-
194
-
195
-
196
 |
 |

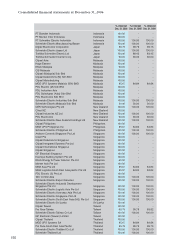
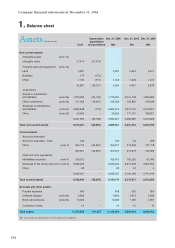
Depreciation Dec. 31, 2006 Dec. 31, 2005 Dec. 31, 2004
Assets (thousands)
amortization
Cost
and provisions
Net Net Net
Non-current assets:
Intangible assets (note 1a)
Intangible rights 27,474 (27,474) - - -
Property, plant and equipment (note 1b)
Land 3,281 - 3,281 3,444 3,671
Buildings 172 (172) - - -
Other 1,730 (511) 1,219 1,203 1,207
32,657 (28,157) 4,500 4,647 4,878
Investments
Shares in subsidiaries
and affiliates
(note 2a)
1,819,483 (40,123) 1,779,360 2,014,108 1,880,685
Other investments
(note 2b)
211,063 (16,497) 194,566 132,835 159,348
Advances to subsidiaries
and affiliates
(note 2c)
2,980,848 (173) 2,980,675 2,972,761 2,972,874
Other
(note 2d)
30,200 - 30,200 177,161 189,921
5,041,594 (56,793) 4,984,801 5,296,865 5,202,828
Total non-current assets 5,074,251 (84,950) 4,989,301 5,301,512 5,207,706
Current assets:
Accounts receivable
Accounts receivable - trade 193 - 193 52 228
Other
(note 3)
350,714 (46,297) 304,417 214,626 131,778
350,907 (46,297) 304,610 214,678 132,006
Cash and cash equivalents
Marketable securities
(note 4)
169,012 - 169,012 182,262 87,046
Advances to the Group cash pool
(note 5)
5,666,443 - 5,666,443 3,917,909 2,654,394
Other 82 - 82 22 4
5,835,537 - 5,835,537 4,100,193 2,741,444
Total current assets 6,186,444 (46,297) 6,140,147 4,314,871 2,873,450
Accruals and other assets:
Prepaid expenses 496 - 496 553 856
Deferred charges
(note 6a)
3,826 - 3,826 4,573 2,309
Bond call premiums
(note 6b)
10,229 - 10,229 7,485 2,091
Conversion losses 10 - 10 10 10
Total assets 11,275,256 131,247 11,144,009 9,629,004 8,086,422
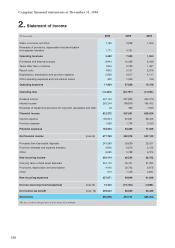
The notes form an integral part of these financial statements.
1. Balance sheet
Company financial statements at December 31, 2006
154