APC 2006 Annual Report Download - page 135
Download and view the complete annual report
Please find page 135 of the 2006 APC annual report below. You can navigate through the pages in the report by either clicking on the pages listed below, or by using the keyword search tool below to find specific information within the annual report.-
 1
1 -
2
-
3
-
4
-
5
-
6
-
7
-
8
-
9
-
10
-
11
-
12
-
13
-
14
-
15
-
16
-
17
-
18
-
19
-
20
-
21
-
22
-
23
-
24
-
25
-
26
-
27
-
28
-
29
-
30
-
31
-
32
-
33
-
34
-
35
-
36
-
37
-
38
-
39
-
40
-
41
-
42
-
43
-
44
-
45
-
46
-
47
-
48
-
49
-
50
-
51
-
52
-
53
-
54
-
55
-
56
-
57
-
58
-
59
-
60
-
61
-
62
-
63
-
64
-
65
-
66
-
67
-
68
-
69
-
70
-
71
-
72
-
73
-
74
-
75
-
76
-
77
-
78
-
79
-
80
-
81
-
82
-
83
-
84
-
85
-
86
-
87
-
88
-
89
-
90
-
91
-
92
-
93
-
94
-
95
-
96
-
97
-
98
-
99
-
100
-
101
-
102
-
103
-
104
-
105
-
106
-
107
-
108
-
109
-
110
-
111
-
112
-
113
-
114
-
115
-
116
-
117
-
118
-
119
-
120
-
121
-
122
-
123
-
124
-
 125
125 -
 126
126 -
 127
127 -
 128
128 -
 129
129 -
 130
130 -
 131
131 -
 132
132 -
 133
133 -
 134
134 -
 135
135 -
 136
136 -
 137
137 -
 138
138 -
 139
139 -
 140
140 -
 141
141 -
 142
142 -
 143
143 -
 144
144 -
 145
145 -
146
-
147
-
148
-
149
-
150
-
151
-
152
-
153
-
154
-
155
-
156
-
157
-
158
-
159
-
160
-
161
-
162
-
163
-
164
-
165
-
166
-
167
-
168
-
169
-
170
-
171
-
172
-
173
-
174
-
175
-
176
-
177
-
178
-
179
-
180
-
181
-
182
-
183
-
184
-
185
-
186
-
187
-
188
-
189
-
190
-
191
-
192
-
193
-
194
-
195
-
196
 |
 |

133
5
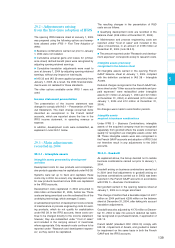
Note 27 - Employees
27.1 - Number of employees
The average number of permanent and temporary employees was as follows :
(number of employees)
2006 2005 2004
Production 46,135 40,792 39,092
Administration 53,943 47,878 45,102
Total average number of employees 100,078 88,670 84,194
By region:
Europe 46,962 43,626 43,444
North America 23,610 21,724 19,028
Asia-Pacific 22,753 17,379 15,576
Rest of the World 6,753 5,941 6,146
The increase in employee numbers primarily reflects acquisitions for the year.
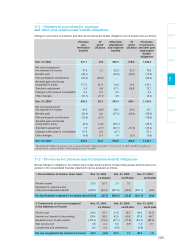
27.2 - Employee benefits expense
2006 2005 2004
Payroll costs (1) (3,796.7) (3,485.8) (3,307.6)
Profit-sharing and incentive bonuses (78.4) (62.4) (72.7)
Stock options (20.8) (16.8) (8.9)
Total employee benefits expense (3,895.9) (3,565.0) (3,389.2)
(1) Including €44.3 million for pension and other post-employment benefits and €26.4 million for other employee benefits
(note 15)
27.3 - Management
compensation and benefits
In 2006, directors’ fees of 0.7 million were paid to the
members of the Board of Directors. Total gross com-
pensation paid to members of senior management
(excluding corporate officers) amounted to 7.6 mil-
lion, of which 4.2 million in variable bonuses.
A total of 3,464,900 options to purchase existing
shares or subscribe new shares and 4,800 shares
without consideration have been granted to members
of Management through plans set up since 1998.
Pension and other post-employment benefit obliga-
tions with respect to members of Management
amounted to 41 million at December 31, 2006.
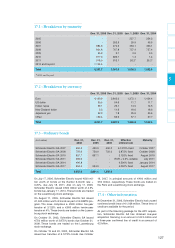
Note 26 - Finance costs and other financial income and expense, net
This item consists solely of income and expense relating to financial assets (including cash and cash equivalents)
and debt.
2006 2005 2004
Interest income 34.1 40.3 36.1
Interest expense (188.6) (156.4) (126.5)
Net gains/(losses) on the sale of marketable securities 50.5 13.0 26.0
Finance costs, net (104.0) (103.1) (64.4)
Dividend income 10.7 8.6 5.9
Exchange gains and losses, net (15.5) 7.3 3.8
Impairment losses on financial assets 18.2 (5.7) 1.1
Discounting adjustments to non-current assets and liabilities 2.0 (7.8) (1.4)
Net gains/(losses) on disposal of long-term investments (20.0) (2.8) -
Fair value adjustments* 0.1 0.6 -
Other financial expense, net (12.4) (1.7) (4.3)
Finance costs and other financial income and expense, net (120.9) (104.6) (59.3)
* IAS 32/39 applied as from January 1, 2005.