APC 2006 Annual Report Download - page 99
Download and view the complete annual report
Please find page 99 of the 2006 APC annual report below. You can navigate through the pages in the report by either clicking on the pages listed below, or by using the keyword search tool below to find specific information within the annual report.-
 1
1 -
2
-
3
-
4
-
5
-
6
-
7
-
8
-
9
-
10
-
11
-
12
-
13
-
14
-
15
-
16
-
17
-
18
-
19
-
20
-
21
-
22
-
23
-
24
-
25
-
26
-
27
-
28
-
29
-
30
-
31
-
32
-
33
-
34
-
35
-
36
-
37
-
38
-
39
-
40
-
41
-
42
-
43
-
44
-
45
-
46
-
47
-
48
-
49
-
50
-
51
-
52
-
53
-
54
-
55
-
56
-
57
-
58
-
59
-
60
-
61
-
62
-
63
-
64
-
65
-
66
-
67
-
68
-
69
-
70
-
71
-
72
-
73
-
74
-
75
-
76
-
77
-
78
-
79
-
80
-
81
-
82
-
83
-
84
-
85
-
86
-
87
-
88
-
 89
89 -
 90
90 -
 91
91 -
 92
92 -
 93
93 -
 94
94 -
 95
95 -
 96
96 -
 97
97 -
 98
98 -
 99
99 -
 100
100 -
 101
101 -
 102
102 -
 103
103 -
 104
104 -
 105
105 -
 106
106 -
 107
107 -
 108
108 -
 109
109 -
110
-
111
-
112
-
113
-
114
-
115
-
116
-
117
-
118
-
119
-
120
-
121
-
122
-
123
-
124
-
125
-
126
-
127
-
128
-
129
-
130
-
131
-
132
-
133
-
134
-
135
-
136
-
137
-
138
-
139
-
140
-
141
-
142
-
143
-
144
-
145
-
146
-
147
-
148
-
149
-
150
-
151
-
152
-
153
-
154
-
155
-
156
-
157
-
158
-
159
-
160
-
161
-
162
-
163
-
164
-
165
-
166
-
167
-
168
-
169
-
170
-
171
-
172
-
173
-
174
-
175
-
176
-
177
-
178
-
179
-
180
-
181
-
182
-
183
-
184
-
185
-
186
-
187
-
188
-
189
-
190
-
191
-
192
-
193
-
194
-
195
-
196
 |
 |

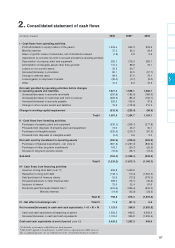
(in millions of euros)
2006 2005* 2004
I - Cash flows from operating activities:
Profit attributable to equity holders of the parent 1,309.4 994.3 823.9
Minority interests 37.2 35.2 34.4
Share of (profit)/ losses of associates, net of dividends received (1.9) 2.8 3.5
A
djustments to reconcile net profit to net cash provided by operating activities:
Depreciation of property, plant and equipment 282.1 279.3 285.7
Amortization of intangible assets other than goodwill 110.4 88.8 76.7
Losses on non current assets 32.2 20.7
Increase/(decrease) in provisions 80.7 22.5 (27.7)
Change in deferred taxes 99.0 97.0 78.1
Losses/(gains) on disposals of assets (38.0) (0.7) (9.0)
Other 10.2 8.2 16.5
Net cash provided by operating activities before changes
in operating assets and liabilities 1,921.3 1,548.1 1,282.1
(Increase)/decrease in accounts receivable (255.8) (185.0) (186.0)
(Increase)/decrease in inventories and work in process (382.5) (85.2) (162.1)
Increase/(decrease) in accounts payable 225.0 165.6 37.9
Change in other current assets and liabilities 79.9 (118.8) 212.2
Change in working capital requirement (333.4) (223.4) (98.0)
Total I 1,587.9 1,324.7 1,184.1
II - Cash flows from investing activities:
Purchases of property, plant and equipment (330.1) (308.1) (277.8)
Proceeds from disposals of property, plant and equipment 76.6 45.2 45.1
Purchases of intangible assets (225.4) (213.7) (97.2)
Proceeds from disposals of intangible assets (2.0) 0.6 0.4
Net cash used by investment in operating assets (480.9) (476.0) (329.5)
Purchases of financial investments - net
(note 3)
(897.8) (1,267.3) (800.9)
Purchases of other long-term investments 163.1 (20.7) (25.5)
Increase in long-term pension assets (19.6) (48.1) (13.4)
Sub-total (754.3) (1,336.1) (839.8)
Total II (1,235.2) (1,812.1) (1,169.3)
III - Cash flows from financing activities:
Issuance of long-term debt
(note 17)
996.8 1,490.9 -
Repayment of long-term debt (148.7) (70.4) (1,352.3)
Sale/(purchase) of treasury shares 52.9 (73.2) (278.2)
Increase/(reduction) in other financial debt 298.5 (76.1) (49.6)
Issuance of shares 76.5 22.4 61.0
Dividends paid: Schneider Electric SA (1) (502.6) (395.4) (334.2)
Minority interests (14.6) (22.9) (23.3)
Total III 758.8 875.3 (1,976.6)
IV - Net effect of exchange rate : Total IV 11.5 (31.1) 6.0
Net increase/(decrease) in cash and cash equivalents: I + II + III + IV 1,123.0 356.8 (1,955.8)
Cash and cash equivalents at beginning of period 1,303.3 946.5 2,902.4
Increase/(decrease) in cash and cash equivalents 1,123.0 356.8 (1,955.9)
Cash and cash equivalents at end of period
(note 13)
2,426.2 1,303.3 946.5
(1) Includes a précompte withholding tax back payment.
* IAS 32/39 applied as from January 1, 2005 with no adjustment for 2004 (note 2).
The accompanying notes are an integral part of the consolidated financial statements.
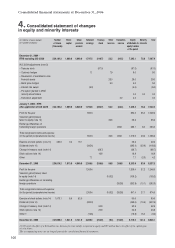
2. Consolidated statement of cash flows
5
97