APC 2006 Annual Report Download - page 140
Download and view the complete annual report
Please find page 140 of the 2006 APC annual report below. You can navigate through the pages in the report by either clicking on the pages listed below, or by using the keyword search tool below to find specific information within the annual report.-
 1
1 -
2
-
3
-
4
-
5
-
6
-
7
-
8
-
9
-
10
-
11
-
12
-
13
-
14
-
15
-
16
-
17
-
18
-
19
-
20
-
21
-
22
-
23
-
24
-
25
-
26
-
27
-
28
-
29
-
30
-
31
-
32
-
33
-
34
-
35
-
36
-
37
-
38
-
39
-
40
-
41
-
42
-
43
-
44
-
45
-
46
-
47
-
48
-
49
-
50
-
51
-
52
-
53
-
54
-
55
-
56
-
57
-
58
-
59
-
60
-
61
-
62
-
63
-
64
-
65
-
66
-
67
-
68
-
69
-
70
-
71
-
72
-
73
-
74
-
75
-
76
-
77
-
78
-
79
-
80
-
81
-
82
-
83
-
84
-
85
-
86
-
87
-
88
-
89
-
90
-
91
-
92
-
93
-
94
-
95
-
96
-
97
-
98
-
99
-
100
-
101
-
102
-
103
-
104
-
105
-
106
-
107
-
108
-
109
-
110
-
111
-
112
-
113
-
114
-
115
-
116
-
117
-
118
-
119
-
120
-
121
-
122
-
123
-
124
-
125
-
126
-
127
-
128
-
129
-
 130
130 -
 131
131 -
 132
132 -
 133
133 -
 134
134 -
 135
135 -
 136
136 -
 137
137 -
 138
138 -
 139
139 -
 140
140 -
 141
141 -
 142
142 -
 143
143 -
 144
144 -
 145
145 -
 146
146 -
 147
147 -
 148
148 -
 149
149 -
 150
150 -
151
-
152
-
153
-
154
-
155
-
156
-
157
-
158
-
159
-
160
-
161
-
162
-
163
-
164
-
165
-
166
-
167
-
168
-
169
-
170
-
171
-
172
-
173
-
174
-
175
-
176
-
177
-
178
-
179
-
180
-
181
-
182
-
183
-
184
-
185
-
186
-
187
-
188
-
189
-
190
-
191
-
192
-
193
-
194
-
195
-
196
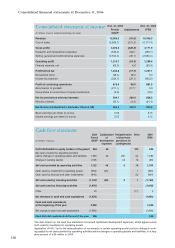
 |
 |
Consolidated statement of income Dec. 31, 2004 Dec. 31, 2004
French
Adjustments
IFRS
(in millions of euros except for earnings per share)
GAAP
Revenue 10,365.3
(16.0)
10,349.3
Cost of sales (5,965.1)
(212.3)
(6,177.4)
Gross profit 4,400.2
(228.3)
4,171.9
Research and development expenses (535.2)
240.1
(295.1)
Selling, general and administrative expenses (2,554.3)
(36.1)
(2,590.4)
Operating profit 1,310.7
(24.3)
1,286.4
Finance expense, net (65.9)
6.6
(59.3)
Profit before tax 1,244.8
(17.7)
1,227.1
Exceptional items (96.3)
96.3
0.0
Income tax expense (333.1)
(32.1)
(365.2)
Profit of continuing operations 815.4
46.5
861.9
Amortization of goodwill (217.1)
217.1
0.0
Group share in income/loss of equity investments (3.6) (3.6)
Net income before minority interests 594.7
263.6
858.3
Minority interests (30.1)
(4.3)
(34.4)
Net income (attributable to Schneider Electric SA) 564.6
259.3
823.9
Basic earnings per share (in euros) 2.56 3.73
Diluted earnings per share (in euros) 2.55 3.72
Cash flow statement
2004
Capitalization Reclassification
Other 2004
French of of short-term IFRS
(in millions of euros)
GAAP development provisions for
expenses contingencies
Profit attributable to equity holders of the parent 565 46 213 824
Net cash provided by operating activities
before changes in operating assets and liaiblities 1,260 46 (24) (0) 1,282
Change in working capital (138) 24 16 (98)
Net cash provided by operating activities 1,122 46 0 16 1,184
Cash used by investment in operating assets (284) (46) 1 (329)
Cash used by financial and other investments (840) (0) (840)
Net cash used by investing activities (1,124) (46) 0 1 (1,169)
Net cash used by financing activities (1,976) (1,976)
Other 22 (17) 5
Net decrease in cash and cash equivalents (1,956) (1,956)
Cash and cash equivalents
at the beginning of the year 2,902 2,902
Net change in cash and cash equivalents (1,956) (1,956)
C
ash and cash equivalents at the end of the year
946 946
The main impact on the cash flow statement concerned capitalized development expenses, which appear under
cash used by investment in operating assets.
Application of IAS 7 led to the reclassification of movements in certain operating provisions from change in work-
ing capital to net cash provided by operating activities before changes in operating assets and liabilities, in a neg-
ative amount of 24 million in 2004.
Consolidated financial statements at December 31, 2006
138