APC 2006 Annual Report Download - page 71
Download and view the complete annual report
Please find page 71 of the 2006 APC annual report below. You can navigate through the pages in the report by either clicking on the pages listed below, or by using the keyword search tool below to find specific information within the annual report.-
 1
1 -
2
-
3
-
4
-
5
-
6
-
7
-
8
-
9
-
10
-
11
-
12
-
13
-
14
-
15
-
16
-
17
-
18
-
19
-
20
-
21
-
22
-
23
-
24
-
25
-
26
-
27
-
28
-
29
-
30
-
31
-
32
-
33
-
34
-
35
-
36
-
37
-
38
-
39
-
40
-
41
-
42
-
43
-
44
-
45
-
46
-
47
-
48
-
49
-
50
-
51
-
52
-
53
-
54
-
55
-
56
-
57
-
58
-
59
-
60
-
 61
61 -
 62
62 -
 63
63 -
 64
64 -
 65
65 -
 66
66 -
 67
67 -
 68
68 -
 69
69 -
 70
70 -
 71
71 -
 72
72 -
 73
73 -
 74
74 -
 75
75 -
 76
76 -
 77
77 -
 78
78 -
 79
79 -
 80
80 -
 81
81 -
82
-
83
-
84
-
85
-
86
-
87
-
88
-
89
-
90
-
91
-
92
-
93
-
94
-
95
-
96
-
97
-
98
-
99
-
100
-
101
-
102
-
103
-
104
-
105
-
106
-
107
-
108
-
109
-
110
-
111
-
112
-
113
-
114
-
115
-
116
-
117
-
118
-
119
-
120
-
121
-
122
-
123
-
124
-
125
-
126
-
127
-
128
-
129
-
130
-
131
-
132
-
133
-
134
-
135
-
136
-
137
-
138
-
139
-
140
-
141
-
142
-
143
-
144
-
145
-
146
-
147
-
148
-
149
-
150
-
151
-
152
-
153
-
154
-
155
-
156
-
157
-
158
-
159
-
160
-
161
-
162
-
163
-
164
-
165
-
166
-
167
-
168
-
169
-
170
-
171
-
172
-
173
-
174
-
175
-
176
-
177
-
178
-
179
-
180
-
181
-
182
-
183
-
184
-
185
-
186
-
187
-
188
-
189
-
190
-
191
-
192
-
193
-
194
-
195
-
196
 |
 |

the impact of the purchase accounting on balance
sheet line items cannot be estimated at this stage. The
global impact on net assets is estimated at $4.5 billion
before purchase accounting.
Other acquisitions
The Group is currently negotiating or finalizing several
transactions (acquisitions, participations and/or part-
nerships) for a total enterprise value of about 800
millions. This amount includes in particular two proj-
ects already announced: SBVE (Shaanxi Baoguang
Vacuum Electronic) and Delixi Electric.
On June 27, 2006, the Group announced its intention
of taking an equity stake of about 40% in SBVE
(Shaanxi Baoguang Vacuum Electronic), a leading
China-based manufacturer of Vacuum Interrupters.
Such an equity stake may only be obtained if the equi-
ty reform plan presented by SBVE is approved by rel-
evant authorities and shareholders, and a number of
other conditions precedent are satisfied.
On December 18, 2006, the Group announced that it
had signed an agreement to create Delixi Electric, a
joint venture with Chinese partner Delixi Group. The
50-50 joint venture will manufacture, market and dis-
tribute low-voltage products in China, pending
approval from local authorities.
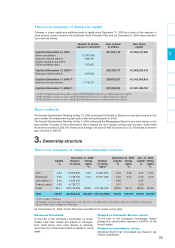
Exchange rate fluctuations
Fluctuations in the euro exchange rate had a very lim-
ited impact compared with 2005, reducing consolidat-
ed revenue by 3 million and lifting operating profit by
1 million.
Revenue
Consolidated revenue totaled 13,730 million for the
year ended December 31, 2006, up 17.6% on a cur-
rent structure and currency basis from the year before.
The Group achieved record organic growth of 10.7%
for full-year 2006. Acquisitions accounted for 6.9% of
growth.
Breakdown by region
Data by region includes the contribution from Critical
Power activities.
Revenue in Europe rose 13.5% to 6,402 million on a
current basis. On a constant structure and currency
basis, the increase came to 9.6%.
This excellent performance, attributable to strong
demand in all end markets, demonstrates Schneider
Electric’s ability to generate additional growth by lever-
aging an expanded product portfolio and developing
services. Growth was strong in most European coun-
tries, with particularly good increases in the UK and
Spain (higher than 10%). Revenue climbed by nearly
13% in Eastern Europe, led by the very active con-
struction market.
In North America, revenue rose 21.3% on a current
basis, to 3,698 million, and 7.5% on a constant struc-
ture and currency basis. Firm demand in the non-resi-
dential building market offsets the decline in the resi-
dential market.
Revenue from the Asia-Pacific division totaled 2,514
million, up 23.8% on a current basis and 15.7% on a
constant basis.
The region’s contribution continued to be driven by
high growth in China (over 15%), India and Southeast
Asia. These countries are benefiting from the powerful
momentum generated by investment in infrastructure
and industry.
Revenue from the Rest of the World rose 16.6% on a
current basis, to 1,116 million, and 17.6% on a con-
stant structure and currency basis. Sustained strong
demand in the Middle East (notably from numerous
infrastructure projects), Africa and South America sup-
ported the region’s overall performance.
Breakdown by business
Electrical Distribution generated revenue of 8,605
million, or 62.7% of the consolidated total. This repre-
sents an increase of 17.8% on a current basis and
11.8% like-for-like.
Automation & Control revenue rose 17.2% on a current
basis to 4,456 million. Like-for-like growth came to
7.8%.
Critical power generated revenue of 668 million. This
represents an increase of 17.4% on a current basis
and 15.1% on a constant basis.
Operating profit
Data by region includes the contribution from Critical
Power activities.
Operating profit rose a reported 27.8% to 2,001 mil-
lion from 1,565 million in 2005. On a constant struc-
ture and currency basis, the increase came to 21.1%.
The operating margin widened 1.2 points over the year
to 14.6% from 13.4%.
Operating profit includes an 18 million charge for
amortization of intangible assets recognized on busi-
ness combinations in 2006, versus 13 million in
2005. The Group measures operating performance on
the basis of EBITA (Earnings Before Interest, Taxes
and Amortization of purchase accounting intangibles).
During the year, EBITA margin grew by 1.2 points to
14.7% from 13.5%.
The increase in raw material costs over the year (227
million) was widely passed on in higher selling prices
(141 million) and also partially offset by productivity
gains in the Group’s manufacturing operations (307
million).
Operating profit includes 116 million in non-recurring
expenses related to asset impairment (35 million)
and restructuring programs (81 million). At Decem-
ber 31, 2005, non-recurring impairment and restructur-
ing expenses totaled 115 million.
Non-recurring expenses primarily stemmed from the
reorganization of the Building Automation business in
Europe, for 16 million, continued industrial reorgani-
zation in the Group's core businesses in France, the
UK and Italy, for 67 million, and the reorganization of
operations in Australia, for 7 million.
69
4