APC 2006 Annual Report Download - page 100
Download and view the complete annual report
Please find page 100 of the 2006 APC annual report below. You can navigate through the pages in the report by either clicking on the pages listed below, or by using the keyword search tool below to find specific information within the annual report.-
 1
1 -
2
-
3
-
4
-
5
-
6
-
7
-
8
-
9
-
10
-
11
-
12
-
13
-
14
-
15
-
16
-
17
-
18
-
19
-
20
-
21
-
22
-
23
-
24
-
25
-
26
-
27
-
28
-
29
-
30
-
31
-
32
-
33
-
34
-
35
-
36
-
37
-
38
-
39
-
40
-
41
-
42
-
43
-
44
-
45
-
46
-
47
-
48
-
49
-
50
-
51
-
52
-
53
-
54
-
55
-
56
-
57
-
58
-
59
-
60
-
61
-
62
-
63
-
64
-
65
-
66
-
67
-
68
-
69
-
70
-
71
-
72
-
73
-
74
-
75
-
76
-
77
-
78
-
79
-
80
-
81
-
82
-
83
-
84
-
85
-
86
-
87
-
88
-
89
-
 90
90 -
 91
91 -
 92
92 -
 93
93 -
 94
94 -
 95
95 -
 96
96 -
 97
97 -
 98
98 -
 99
99 -
 100
100 -
 101
101 -
 102
102 -
 103
103 -
 104
104 -
 105
105 -
 106
106 -
 107
107 -
 108
108 -
 109
109 -
 110
110 -
111
-
112
-
113
-
114
-
115
-
116
-
117
-
118
-
119
-
120
-
121
-
122
-
123
-
124
-
125
-
126
-
127
-
128
-
129
-
130
-
131
-
132
-
133
-
134
-
135
-
136
-
137
-
138
-
139
-
140
-
141
-
142
-
143
-
144
-
145
-
146
-
147
-
148
-
149
-
150
-
151
-
152
-
153
-
154
-
155
-
156
-
157
-
158
-
159
-
160
-
161
-
162
-
163
-
164
-
165
-
166
-
167
-
168
-
169
-
170
-
171
-
172
-
173
-
174
-
175
-
176
-
177
-
178
-
179
-
180
-
181
-
182
-
183
-
184
-
185
-
186
-
187
-
188
-
189
-
190
-
191
-
192
-
193
-
194
-
195
-
196
 |
 |

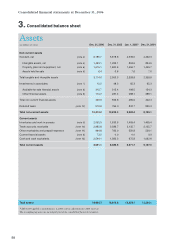
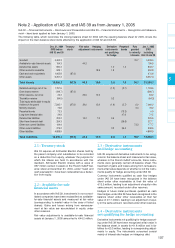
Assets
(in millions of euros)
Dec. 31, 2006 Dec. 31, 2005 Jan. 1, 2005* Dec. 31, 2004
Non-current assets
Goodwill, net
(note 4)
6,185.7 5,878.8 4,539.0 4,462.3
Intangible assets, net
(note 5)
1,493.1 1,299.1 894.5 894.5
Property, plant and equipment, net
(note 6)
1,615.1 1,600.6 1,456.7 1,456.7
Assets held for sale
(note 6)
6.4 6.8 7.6 7.6
Total tangible and intangible assets 3,114.6 2,906.5 2,358.8 2,358.8
Investments in associates
(note 7)
10.2 48.2 65.3 65.3
Available-for-sale financial assets
(note 8)
315.7 315.4 198.5 154.3
Other financial assets
(note 8)
114.2 281.4 288.1 288.1
Total non current financial assets 429.9 596.8 486.6 442.4
Deferred taxes
(note 12)
672.8 795.0 832.7 830.3
Total non-current assets 10,413.2 10,225.3 8,282.4 8,159.1
Current assets
Inventories and work in process
(note 9)
2,055.9 1,636.6 1,409.4 1,409.4
Trade accounts receivable
(note 10)
2,882.8 2,586.7 2,135.7 2,135.7
Other receivables and prepaid expenses
(note 11)
994.8 783.0 550.8 529.1
Current financial assets
(note 8)
73.5 0.0 0.0 0.0
Cash and cash equivalents
(note 13)
2,544.1 1,383.2 975.8 1,062.8
Total current assets 8,551.1 6,389.5 5,071.7 5,137.0
Total assets 18,964.3 16,614.8 13,354.1 13,296.1
* IAS 32/39 applied as from January 1, 2005 with no adjustment for 2004 (note 2).
The accompanying notes are an integral part of the consolidated financial statements.
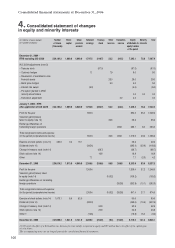
3. Consolidated balance sheet
Consolidated financial statements at December 31, 2006
98