APC 2006 Annual Report Download - page 116
Download and view the complete annual report
Please find page 116 of the 2006 APC annual report below. You can navigate through the pages in the report by either clicking on the pages listed below, or by using the keyword search tool below to find specific information within the annual report.-
 1
1 -
2
-
3
-
4
-
5
-
6
-
7
-
8
-
9
-
10
-
11
-
12
-
13
-
14
-
15
-
16
-
17
-
18
-
19
-
20
-
21
-
22
-
23
-
24
-
25
-
26
-
27
-
28
-
29
-
30
-
31
-
32
-
33
-
34
-
35
-
36
-
37
-
38
-
39
-
40
-
41
-
42
-
43
-
44
-
45
-
46
-
47
-
48
-
49
-
50
-
51
-
52
-
53
-
54
-
55
-
56
-
57
-
58
-
59
-
60
-
61
-
62
-
63
-
64
-
65
-
66
-
67
-
68
-
69
-
70
-
71
-
72
-
73
-
74
-
75
-
76
-
77
-
78
-
79
-
80
-
81
-
82
-
83
-
84
-
85
-
86
-
87
-
88
-
89
-
90
-
91
-
92
-
93
-
94
-
95
-
96
-
97
-
98
-
99
-
100
-
101
-
102
-
103
-
104
-
105
-
 106
106 -
 107
107 -
 108
108 -
 109
109 -
 110
110 -
 111
111 -
 112
112 -
 113
113 -
 114
114 -
 115
115 -
 116
116 -
 117
117 -
 118
118 -
 119
119 -
 120
120 -
 121
121 -
 122
122 -
 123
123 -
 124
124 -
 125
125 -
 126
126 -
127
-
128
-
129
-
130
-
131
-
132
-
133
-
134
-
135
-
136
-
137
-
138
-
139
-
140
-
141
-
142
-
143
-
144
-
145
-
146
-
147
-
148
-
149
-
150
-
151
-
152
-
153
-
154
-
155
-
156
-
157
-
158
-
159
-
160
-
161
-
162
-
163
-
164
-
165
-
166
-
167
-
168
-
169
-
170
-
171
-
172
-
173
-
174
-
175
-
176
-
177
-
178
-
179
-
180
-
181
-
182
-
183
-
184
-
185
-
186
-
187
-
188
-
189
-
190
-
191
-
192
-
193
-
194
-
195
-
196
 |
 |

Consolidated financial statements at December 31, 2006
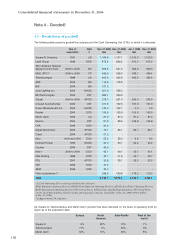
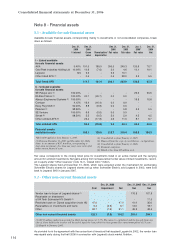
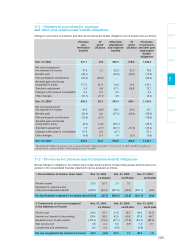
Note 8 - Financial assets
8.1 - Available-for-sale financial assets
Available-for-sale financial assets, corresponding mainly to investments in non-consolidated companies, break
down as follows:
Dec. 31, Dec. 31, Dec. 31, Dec. 31, Jan. 1, Dec. 31,
2006 2006 2006 2005 2005* 2004
% interest Gross Reevaluation/ Fair value Fair value Fair value Net
value depreciation
I – Listed available
for sale financial assets
AXA 0.40% 101.5 199.0 300.5 240.3 120.9 76.7
Gold Peak Industries Holding Ltd
10.06% 10.6 (7.6) 3.0 4.6 10.1 10.1
Legrand NS 2.2 - 2.2 10.1 - -
Other listed AFS (1) - 0.4 - 0.4 38.0 5.5 5.5
Total listed AFS 114.7 191.4 306.1 293.0 136.5 92.3
II – Unlisted available
for sale financial assets
SE Relays LLC (2) 100.00% - - - - 26.5 26.5
Eb@se France (3) 100.00% 20.7 (20.7) 0.0 0.0 - -
Abacus Engineered Systems
(2) 100.00% - - - - 16.8 16.8
Comipar 4.15% 16.4 (16.4) 0.0 0.0 - -
Easy Plug SAS (3) 50.00% 8.8 (8.8) 0.0 0.0 - -
Paramer (4) 98.96% - - - 5.8 5.5 5.5
SE Venture 100.00% 6.6 (6.6) 0.0 0.0 - -
Simak (5) 98.50% 5.5 (0.5) 5.0 5.0 4.5 4.5
Other unlisted AFS (6) 22.4 (17.8) 4.6 11.6 8.7 8.7
Total unlisted AFS 80.4 (70.8) 9.6 22.4 62.0 62.0
Financial assets
available-for-sale 195.1 120.6 315.7 315.4 198.5 154.3
*
IAS 32/39 applied as from January 1, 2005.
(1) Between December 31, 2005 and December 31, 2006,
shares in an amount of €37.6 million, corresponding to
short-term investments (less than one year), were reclassified
under current financial assets.
(2) Consolidated as from January 1, 2005.
(3) Removed from the scope of consolidation – in liquidation.
(4) Consolidated as from January 1, 2006.
(5) Dormant companies.
(6) Valued at less than €5 million each.
Fair value corresponds to the closing listed price for investments listed in an active market and the carrying
amount for unlisted investments. Net gains arising from remeasurement at fair value of listed investments, record-
ed in equity under “Other reserves” (note 14.7), totaled 40.7 million.
The Legrand shares held at December 31, 2006, which were acquired under the mechanism for exchanging
Schneider Electric shares for Legrand shares set up when Schneider Electric sold Legrand in 2002, were sold
back to Legrand SAS in January 2007.
As provided for in the agreement with the consortium of investors that acquired Legrand in 2002, the vendor loan
was repaid early during first-half 2006 in connection with Legrand’s stock market flotation.
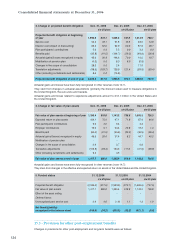
8.2 - Other non-current financial assets
Dec. 31, 2006 Dec. 31, 2005 Dec. 31, 2004
Cost Impairment Net Net Net
Vendor loan to buyer of Legrand shares (1) - - - 176.8 167.9
Receivable on divestment
of VA Tech Schneider HV GmbH (2) - - - - 17.5
Restricted cash on Clipsal acquisition (note 18) 47.0 - 47.0 41.4 35.6
Receivables on investments and loans 6.4 (0.3) 6.1 14.0 18.7
Other 68.7 (7.6) 61.1 49.2 48.4
Other non current financial assets 122.1 (7.9) 114.2 281.4 288.1
(1) €150 million vendor loan granted in 2002, paying interest at 5.5%.The interest is capitalized and the proceeds from any
sales of shares held by the investor will be used to repay the loan, which has been granted for a maximum period of 13 years.
(2) Repaid in January 2005.
114