Siemens 2007 Annual Report Download - page 119
Download and view the complete annual report
Please find page 119 of the 2007 Siemens annual report below. You can navigate through the pages in the report by either clicking on the pages listed below, or by using the keyword search tool below to find specific information within the annual report.-
 1
1 -
2
-
3
-
4
-
5
-
6
-
7
-
8
-
9
-
10
-
11
-
12
-
13
-
14
-
15
-
16
-
17
-
18
-
19
-
20
-
21
-
22
-
23
-
24
-
25
-
26
-
27
-
28
-
29
-
30
-
31
-
32
-
33
-
34
-
35
-
36
-
37
-
38
-
39
-
40
-
41
-
42
-
43
-
44
-
45
-
46
-
47
-
48
-
49
-
50
-
51
-
52
-
53
-
54
-
55
-
56
-
57
-
58
-
59
-
60
-
61
-
62
-
63
-
64
-
65
-
66
-
67
-
68
-
69
-
70
-
71
-
72
-
73
-
74
-
75
-
76
-
77
-
78
-
79
-
80
-
81
-
82
-
83
-
84
-
85
-
86
-
87
-
88
-
89
-
90
-
91
-
92
-
93
-
94
-
95
-
96
-
97
-
98
-
99
-
100
-
101
-
102
-
103
-
104
-
105
-
106
-
107
-
108
-
 109
109 -
 110
110 -
 111
111 -
 112
112 -
 113
113 -
 114
114 -
 115
115 -
 116
116 -
 117
117 -
 118
118 -
 119
119 -
 120
120 -
 121
121 -
 122
122 -
 123
123 -
 124
124 -
 125
125 -
 126
126 -
 127
127 -
 128
128 -
 129
129 -
130
-
131
-
132
-
133
-
134
-
135
-
136
-
137
-
138
-
139
-
140
-
141
-
142
-
143
-
144
-
145
-
146
-
147
-
148
-
149
-
150
-
151
-
152
-
153
-
154
-
155
-
156
-
157
-
158
-
159
-
160
-
161
-
162
-
163
-
164
-
165
-
166
-
167
-
168
-
169
-
170
-
171
-
172
-
173
-
174
-
175
-
176
-
177
-
178
-
179
-
180
-
181
-
182
-
183
-
184
-
185
-
186
-
187
-
188
-
189
-
190
-
191
-
192
-
193
-
194
-
195
-
196
-
197
-
198
-
199
-
200
-
201
-
202
-
203
-
204
-
205
-
206
-
207
-
208
-
209
-
210
-
211
-
212
-
213
-
214
-
215
-
216
-
217
-
218
-
219
-
220
-
221
-
222
-
223
-
224
-
225
-
226
-
227
-
228
-
229
-
230
-
231
-
232
-
233
-
234
-
235
-
236
-
237
-
238
-
239
-
240
-
241
-
242
-
243
-
244
-
245
-
246
-
247
-
248
-
249
-
250
-
251
-
252
-
253
-
254
-
255
-
256
-
257
-
258
-
259
-
260
-
261
-
262
-
263
-
264
-
265
-
266
-
267
-
268
-
269
-
270
-
271
-
272
-
273
-
274
-
275
-
276
-
277
-
278
-
279
-
280
-
281
-
282
-
283
-
284
-
285
-
286
-
287
-
288
-
289
-
290
-
291
-
292
-
293
-
294
-
295
-
296
-
297
-
298
-
299
-
300
-
301
-
302
-
303
-
304
-
305
-
306
-
307
-
308
-
309
-
310
-
311
-
312
-
313
-
314
-
315
-
316
-
317
-
318
-
319
-
320
-
321
-
322
-
323
-
324
-
325
-
326
-
327
-
328
-
329
-
330
-
331
-
332
-
333
-
334
-
335
-
336
 |
 |

Management’s discussion and analysis 119
Management’s discussion and analysis
Fiscal 2007 – Results of Siemens
The following discussion presents selected information for Siemens for the fi scal
years ended:
Siemens booked €83.916 billion in new orders in fi scal 2007. This 12% rise
compared to fi scal 2006 resulted in a book-to-bill ratio of 1.16 for the year. Europe
outside Germany and the Americas were the two largest regions by volume, fol-
lowed by Germany and Asia Pacifi c. Europe outside Germany showed the fastest
growth of any region, with a 19% increase to €26.648 billion for the year led by
strong demand at PG, Med, PTD and A&D and numerous large new contracts.
Orders in Germany were €13.562 billion, up 6% including strong contributions
from A&D, PG and TS.
In the Americas region, orders rose 13% in fi scal 2007, to €22.831 billion,
despite considerable weakening of the U.S. dollar against the euro. Continuing
demand for energy solutions at PG, and for industrial automation solutions at A&D
and I&S, more than compensated for currency and market conditions that led to
reductions in orders in the U.S. at TS, Med, Osram and SBT. As a result, the U.S.
share of orders in the region fell to 73% compared to 78% in fi scal 2006. On an
organic basis, excluding the net effect of portfolio transactions and unusually
strong negative currency translation effects, orders were up 18% and 11% in the
Americas and the U.S. respectively.
Orders in Asia-Pacifi c came in at €13.291 billion, 18% higher than in the prior
year, with PG, A&D, PTD, Med and I&S all winning at least 20% more new business
in the region. Orders in China and India were €4.871 billion and €2.015 billion,
and grew at 12% and 15% respectively, and accounted for 52% of new Asia-Pacifi c
orders. A year earlier, their combined share was 54%. New orders in the Africa,
Near and Middle East, C.I.S. region came in 9% lower year-over-year, at €7.584 bil-
lion, primarily because the prior year included a large order at TS for both trains
and maintenance in Russia. For the region as a whole, PTD, A&D and Osram saw
double-digit order growth for the current period.
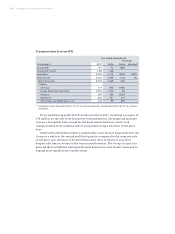
New Orders (location of customer)
Year ended
September 30,
% Change
vs. previous year therein
(€ in millions) 2007 2006 Actual Adjusted* Currency Portfolio
Germany 13,562 12,782 6% 5% 0% 1%
Europe (other than Germany) 26,648 22,351 19% 18% 0% 1%
Americas 22,831 20,202 13% 18% (9)% 4%
Asia-Pacifi c 13,291 11,250 18% 19% (3)% 2%
Africa, Near and
Middle East, C.I.S.** 7,584 8,359 (9)% (7)% (3)% 1%
Siemens 83,916 74,944 12% 13% (3)% 2%
* Excluding currency translation and portfolio effects.
** Commonwealth of Independent States.