Siemens 2007 Annual Report Download - page 131
Download and view the complete annual report
Please find page 131 of the 2007 Siemens annual report below. You can navigate through the pages in the report by either clicking on the pages listed below, or by using the keyword search tool below to find specific information within the annual report.-
 1
1 -
2
-
3
-
4
-
5
-
6
-
7
-
8
-
9
-
10
-
11
-
12
-
13
-
14
-
15
-
16
-
17
-
18
-
19
-
20
-
21
-
22
-
23
-
24
-
25
-
26
-
27
-
28
-
29
-
30
-
31
-
32
-
33
-
34
-
35
-
36
-
37
-
38
-
39
-
40
-
41
-
42
-
43
-
44
-
45
-
46
-
47
-
48
-
49
-
50
-
51
-
52
-
53
-
54
-
55
-
56
-
57
-
58
-
59
-
60
-
61
-
62
-
63
-
64
-
65
-
66
-
67
-
68
-
69
-
70
-
71
-
72
-
73
-
74
-
75
-
76
-
77
-
78
-
79
-
80
-
81
-
82
-
83
-
84
-
85
-
86
-
87
-
88
-
89
-
90
-
91
-
92
-
93
-
94
-
95
-
96
-
97
-
98
-
99
-
100
-
101
-
102
-
103
-
104
-
105
-
106
-
107
-
108
-
109
-
110
-
111
-
112
-
113
-
114
-
115
-
116
-
117
-
118
-
119
-
120
-
 121
121 -
 122
122 -
 123
123 -
 124
124 -
 125
125 -
 126
126 -
 127
127 -
 128
128 -
 129
129 -
 130
130 -
 131
131 -
 132
132 -
 133
133 -
 134
134 -
 135
135 -
 136
136 -
 137
137 -
 138
138 -
 139
139 -
 140
140 -
 141
141 -
142
-
143
-
144
-
145
-
146
-
147
-
148
-
149
-
150
-
151
-
152
-
153
-
154
-
155
-
156
-
157
-
158
-
159
-
160
-
161
-
162
-
163
-
164
-
165
-
166
-
167
-
168
-
169
-
170
-
171
-
172
-
173
-
174
-
175
-
176
-
177
-
178
-
179
-
180
-
181
-
182
-
183
-
184
-
185
-
186
-
187
-
188
-
189
-
190
-
191
-
192
-
193
-
194
-
195
-
196
-
197
-
198
-
199
-
200
-
201
-
202
-
203
-
204
-
205
-
206
-
207
-
208
-
209
-
210
-
211
-
212
-
213
-
214
-
215
-
216
-
217
-
218
-
219
-
220
-
221
-
222
-
223
-
224
-
225
-
226
-
227
-
228
-
229
-
230
-
231
-
232
-
233
-
234
-
235
-
236
-
237
-
238
-
239
-
240
-
241
-
242
-
243
-
244
-
245
-
246
-
247
-
248
-
249
-
250
-
251
-
252
-
253
-
254
-
255
-
256
-
257
-
258
-
259
-
260
-
261
-
262
-
263
-
264
-
265
-
266
-
267
-
268
-
269
-
270
-
271
-
272
-
273
-
274
-
275
-
276
-
277
-
278
-
279
-
280
-
281
-
282
-
283
-
284
-
285
-
286
-
287
-
288
-
289
-
290
-
291
-
292
-
293
-
294
-
295
-
296
-
297
-
298
-
299
-
300
-
301
-
302
-
303
-
304
-
305
-
306
-
307
-
308
-
309
-
310
-
311
-
312
-
313
-
314
-
315
-
316
-
317
-
318
-
319
-
320
-
321
-
322
-
323
-
324
-
325
-
326
-
327
-
328
-
329
-
330
-
331
-
332
-
333
-
334
-
335
-
336
 |
 |

Management’s discussion and analysis 131
Management’s discussion and analysis
Medical Solutions (Med)
Group profi t at Med climbed to €1.323 billion, 34% higher than in fi scal 2006,
and Group profi t margin rose to 13.4%. These results demonstrate the competitive
strength and international success of Med’s diagnostics imaging businesses, which
increased their earnings and profi tability compared to the prior year despite con-
tinuing market pressure in the U.S., including effects from the U.S. Defi cit Reduc-
tion Act (DRA). Med’s equity investment income in fi scal 2007 rose to €60 million
from €27 million a year earlier, benefi ting from a €23 million gain on the sale of a
portion of its stake in a joint venture, Draeger Medical AG & Co. KG. These factors
enabled Med to more than offset the loss of 1.8 percentage points from Group profi t
margin due to PPA effects of €91 million and integration costs of €84 million stem-
ming from two major acquisitions. Diagnostic Products Corp. was acquired late in
fi scal 2006 for approximately €1.4 billion, and a division of Bayer AG was acquired in
the second quarter of fi scal 2007 for approximately €4.5 billion. Med saw a corre-
sponding increase in amortization of intangible assets compared to fi scal 2006.
During fi scal 2007, Med integrated the two acquisitions mentioned above into its
new Diagnostics division. This business provides a wide range of “in-vitro” solutions,
which produce diagnostic information using samples taken from a patient’s body
and tested in a clinical laboratory. The Diagnostics division thus strongly
comple-
ments Med’s imaging businesses, which provide diagnostic information from images
of organs and tissues within the body (“in-vivo”). With these two acquisitions Med
created the fi rst integrated diagnostic company. During fi scal 2007 Med announced
a third acquisition for the Diagnostics division: Dade Behring, Inc., a leading clinical
laboratory diagnostics company. The purchase price for this acquisition, which
closed in the fi rst quarter of fi scal 2008, was approximately $7 billion (€5 billion).
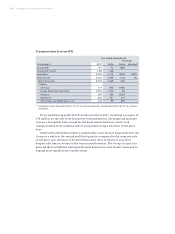
The Diagnostics division brought signifi cant new volume to Med in fi scal 2007.
Orders raised 10%, to €10.271 billion and revenue climbed 20% year-over-year, to
€9.851 billion, on double-digit growth in Germany and all major regions of the world.
Year ended September 30,
% Change
(€ in millions) 2007 2006* Actual Adjusted**
Group profi t 1,323 988 34%
Group profi t margin 13.4% 12.0%
New orders 10,271 9,334 10% (2)%
Total revenue 9,851 8,227 20% 6%
External revenue 9,798 8,164 20%
Therein:
Germany 875 682 28%
Europe (other than Germany) 2,462 1,843 34%
Americas 4,578 4,044 13%
Asia-Pacifi c 1,468 1,222 20%
Africa, Near and Middle East, C.I.S. 415 373 11%
* Group profi t has been adjusted. For further information see ”Notes to Consolidated Financial Statements.”
** Excluding currency translation effects of (5)% on revenue and orders, and portfolio effects of 19% and 17%
on revenue and orders, respectively.