Siemens 2007 Annual Report Download - page 129
Download and view the complete annual report
Please find page 129 of the 2007 Siemens annual report below. You can navigate through the pages in the report by either clicking on the pages listed below, or by using the keyword search tool below to find specific information within the annual report.-
 1
1 -
2
-
3
-
4
-
5
-
6
-
7
-
8
-
9
-
10
-
11
-
12
-
13
-
14
-
15
-
16
-
17
-
18
-
19
-
20
-
21
-
22
-
23
-
24
-
25
-
26
-
27
-
28
-
29
-
30
-
31
-
32
-
33
-
34
-
35
-
36
-
37
-
38
-
39
-
40
-
41
-
42
-
43
-
44
-
45
-
46
-
47
-
48
-
49
-
50
-
51
-
52
-
53
-
54
-
55
-
56
-
57
-
58
-
59
-
60
-
61
-
62
-
63
-
64
-
65
-
66
-
67
-
68
-
69
-
70
-
71
-
72
-
73
-
74
-
75
-
76
-
77
-
78
-
79
-
80
-
81
-
82
-
83
-
84
-
85
-
86
-
87
-
88
-
89
-
90
-
91
-
92
-
93
-
94
-
95
-
96
-
97
-
98
-
99
-
100
-
101
-
102
-
103
-
104
-
105
-
106
-
107
-
108
-
109
-
110
-
111
-
112
-
113
-
114
-
115
-
116
-
117
-
118
-
 119
119 -
 120
120 -
 121
121 -
 122
122 -
 123
123 -
 124
124 -
 125
125 -
 126
126 -
 127
127 -
 128
128 -
 129
129 -
 130
130 -
 131
131 -
 132
132 -
 133
133 -
 134
134 -
 135
135 -
 136
136 -
 137
137 -
 138
138 -
 139
139 -
140
-
141
-
142
-
143
-
144
-
145
-
146
-
147
-
148
-
149
-
150
-
151
-
152
-
153
-
154
-
155
-
156
-
157
-
158
-
159
-
160
-
161
-
162
-
163
-
164
-
165
-
166
-
167
-
168
-
169
-
170
-
171
-
172
-
173
-
174
-
175
-
176
-
177
-
178
-
179
-
180
-
181
-
182
-
183
-
184
-
185
-
186
-
187
-
188
-
189
-
190
-
191
-
192
-
193
-
194
-
195
-
196
-
197
-
198
-
199
-
200
-
201
-
202
-
203
-
204
-
205
-
206
-
207
-
208
-
209
-
210
-
211
-
212
-
213
-
214
-
215
-
216
-
217
-
218
-
219
-
220
-
221
-
222
-
223
-
224
-
225
-
226
-
227
-
228
-
229
-
230
-
231
-
232
-
233
-
234
-
235
-
236
-
237
-
238
-
239
-
240
-
241
-
242
-
243
-
244
-
245
-
246
-
247
-
248
-
249
-
250
-
251
-
252
-
253
-
254
-
255
-
256
-
257
-
258
-
259
-
260
-
261
-
262
-
263
-
264
-
265
-
266
-
267
-
268
-
269
-
270
-
271
-
272
-
273
-
274
-
275
-
276
-
277
-
278
-
279
-
280
-
281
-
282
-
283
-
284
-
285
-
286
-
287
-
288
-
289
-
290
-
291
-
292
-
293
-
294
-
295
-
296
-
297
-
298
-
299
-
300
-
301
-
302
-
303
-
304
-
305
-
306
-
307
-
308
-
309
-
310
-
311
-
312
-
313
-
314
-
315
-
316
-
317
-
318
-
319
-
320
-
321
-
322
-
323
-
324
-
325
-
326
-
327
-
328
-
329
-
330
-
331
-
332
-
333
-
334
-
335
-
336
 |
 |

Management’s discussion and analysis 129
Management’s discussion and analysis
Power Generation (PG)
Group profi t at PG climbed 47% year-over-year, to €1.147 billion in fi scal 2007.
All businesses in PG’s portfolio generated strong growth in earnings and profi t-
ability. Highlights include a signifi cant rise in earnings in the fossil services busi-
ness and a sharply higher 9.5% margin in the wind power business, where earn-
ings more than tripled. While PG faced higher materials costs compared to fi scal
2006, strong demand enabled the Group to offset the increase with higher prices.
Both fi scal years included charges at major projects for PG’s fossil power genera-
tion business. While PG reduced these charges in fi scal 2007, the improvement
was partially offset by negative equity investment income and lower cancellation
gains compared to fi scal 2006. In particular, equity investment income in fi scal
2007 was a negative €2 million due to a negative €45 million result related to PG’s
equity stake in Areva NP, a nuclear power company. In fi scal 2006, equity invest-
ment income was a positive €36 million despite a negative €27 million result
related to Areva NP. The net effect of project charges, equity investment income
and other non-operating effects, including the settlement of an arbitration pro-
ceeding and the sale of a business in fi scal 2007 and the effects of the bankruptcy
of a consortium partner in fi scal 2006 reduced PG’s Group profi t margin by more
than half a percentage point in the current fi scal year and by approximately two
percentage points in the prior year. PG expects continued volatility in equity
investment earnings in coming quarters.
Demand for PG’s power generation solutions was balanced both regionally and
among PG’s divisions. This balance is particularly notable in comparison to the
previous cycle of high global demand for gas turbine energy systems at the begin-
ning of the decade, before PG expanded its industrial turbine business and built
its wind power business. In fi scal 2007, PG’s non-fossil businesses generated 40%
of revenues and 41% of new orders. These total benefi ted from the acquisition of
AG Kühnle Kopp & Kausch in the fi rst quarter of fi scal 2007. Fiscal 2007 orders for
PG overall climbed to €17.988 billion, up 44% year-over-year, and are expected to
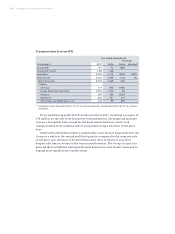
Year ended September 30,
% Change
(€ in millions) 2007 2006 Actual Adjusted*
Group profi t 1,147 779 47%
Group profi t margin 9.4% 7.7%
New orders 17,988 12,532 44% 43%
Total revenue 12,194 10,086 21% 20%
External revenue 12,159 10,068 21%
Therein:
Germany 1,182 1,153 3%
Europe (other than Germany) 2,920 2,267 29%
Americas 3,405 2,706 26%
Asia-Pacifi c 2,024 1,571 29%
Africa, Near and Middle East, C.I.S. 2,628 2,371 11%
* Excluding currency translation effects of (3)% on revenue and orders, and portfolio effects of 4% on revenue
and orders.