Siemens 2007 Annual Report Download - page 260
Download and view the complete annual report
Please find page 260 of the 2007 Siemens annual report below. You can navigate through the pages in the report by either clicking on the pages listed below, or by using the keyword search tool below to find specific information within the annual report.-
 1
1 -
2
-
3
-
4
-
5
-
6
-
7
-
8
-
9
-
10
-
11
-
12
-
13
-
14
-
15
-
16
-
17
-
18
-
19
-
20
-
21
-
22
-
23
-
24
-
25
-
26
-
27
-
28
-
29
-
30
-
31
-
32
-
33
-
34
-
35
-
36
-
37
-
38
-
39
-
40
-
41
-
42
-
43
-
44
-
45
-
46
-
47
-
48
-
49
-
50
-
51
-
52
-
53
-
54
-
55
-
56
-
57
-
58
-
59
-
60
-
61
-
62
-
63
-
64
-
65
-
66
-
67
-
68
-
69
-
70
-
71
-
72
-
73
-
74
-
75
-
76
-
77
-
78
-
79
-
80
-
81
-
82
-
83
-
84
-
85
-
86
-
87
-
88
-
89
-
90
-
91
-
92
-
93
-
94
-
95
-
96
-
97
-
98
-
99
-
100
-
101
-
102
-
103
-
104
-
105
-
106
-
107
-
108
-
109
-
110
-
111
-
112
-
113
-
114
-
115
-
116
-
117
-
118
-
119
-
120
-
121
-
122
-
123
-
124
-
125
-
126
-
127
-
128
-
129
-
130
-
131
-
132
-
133
-
134
-
135
-
136
-
137
-
138
-
139
-
140
-
141
-
142
-
143
-
144
-
145
-
146
-
147
-
148
-
149
-
150
-
151
-
152
-
153
-
154
-
155
-
156
-
157
-
158
-
159
-
160
-
161
-
162
-
163
-
164
-
165
-
166
-
167
-
168
-
169
-
170
-
171
-
172
-
173
-
174
-
175
-
176
-
177
-
178
-
179
-
180
-
181
-
182
-
183
-
184
-
185
-
186
-
187
-
188
-
189
-
190
-
191
-
192
-
193
-
194
-
195
-
196
-
197
-
198
-
199
-
200
-
201
-
202
-
203
-
204
-
205
-
206
-
207
-
208
-
209
-
210
-
211
-
212
-
213
-
214
-
215
-
216
-
217
-
218
-
219
-
220
-
221
-
222
-
223
-
224
-
225
-
226
-
227
-
228
-
229
-
230
-
231
-
232
-
233
-
234
-
235
-
236
-
237
-
238
-
239
-
240
-
241
-
242
-
243
-
244
-
245
-
246
-
247
-
248
-
249
-
 250
250 -
 251
251 -
 252
252 -
 253
253 -
 254
254 -
 255
255 -
 256
256 -
 257
257 -
 258
258 -
 259
259 -
 260
260 -
 261
261 -
 262
262 -
 263
263 -
 264
264 -
 265
265 -
 266
266 -
 267
267 -
 268
268 -
 269
269 -
 270
270 -
271
-
272
-
273
-
274
-
275
-
276
-
277
-
278
-
279
-
280
-
281
-
282
-
283
-
284
-
285
-
286
-
287
-
288
-
289
-
290
-
291
-
292
-
293
-
294
-
295
-
296
-
297
-
298
-
299
-
300
-
301
-
302
-
303
-
304
-
305
-
306
-
307
-
308
-
309
-
310
-
311
-
312
-
313
-
314
-
315
-
316
-
317
-
318
-
319
-
320
-
321
-
322
-
323
-
324
-
325
-
326
-
327
-
328
-
329
-
330
-
331
-
332
-
333
-
334
-
335
-
336
 |
 |

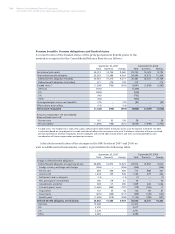
260 Notes to Consolidated Financial Statements
(in millions of €, except where otherwise stated and per share amounts)
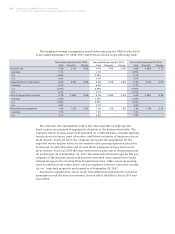
The weighted-average assumptions used for determining the NPBC for the fi scal
years ended September 30, 2008, 2007 and 2006 are shown in the following table:
The discount rate assumptions refl ect the rates available on high-quality,
fi xed-income investments of appropriate duration at the balance sheet date. The
expected return on plan assets is determined on a uniform basis, considering long-
term historical returns, asset allocation, and future estimates of long-term invest-
ment returns. For fi scal 2007, the Company decreased the assumption for the
expected return on plan assets for the majority of its principal pension plans due
to changes in asset allocation and revised future estimates of long-term invest-
ment returns. For fi scal 2008 the expected return on plan assets remained primar-
ily unchanged. As of September 30, 2007, the assumed retirement ages for the par-
ticipants of the domestic pension plans were increased with regard to increased
retirement ages in the German State Pension Insurance. Other actuarial assump-
tions not shown in the tables above, such as employee turnover, mortality, disabil-
ity, etc., remained primarily unchanged as of September 30, 2007.
Experience adjustments, which result from differences between the actuarial
assumptions and the actual occurrence, did not affect the DBO in fi scal 2007 and
fi scal 2006.
Year ending September 30, 2008 Year ended September 30, 2007 Year ended September 30, 2006
Total Domestic Foreign Total Domestic Foreign Total Domestic Foreign
Discount rate 5.3% 5.1% 5.6% 4.7% 4.5% 5.0% 4.6% 4.35% 5.1%
Germany 5.1% 4.5% 4.35%
U.S. 6.29% 5.95% 5.7%
U.K. 6.0% 5.0% 5.0%
Expected return on plan assets 6.5% 6.5% 6.5% 6.5% 6.5% 6.5% 6.7% 6.7% 6.7%
Germany 6.5% 6.5% 6.7%
U.S. 6.97% 6.95% 6.95%
U.K. 6.7% 6.7% 6.75%
Rate of compensation increase 2.7% 2.25% 3.5% 2.7% 2.25% 3.4% 2.6% 2.25% 3.3%
Germany 2.25% 2.25% 2.25%
U.S. 3.96% 3.95% 3.25%
U.K. 4.0% 3.7% 3.9%
Rate of pension progression 1.6% 1.5% 2.0% 1.2% 1.0% 1.8% 1.3% 1.0% 2.1%
Germany 1.5% 1.0% 1.0%
U.K. 3.1% 2.8% 2.8%