Siemens 2007 Annual Report Download - page 135
Download and view the complete annual report
Please find page 135 of the 2007 Siemens annual report below. You can navigate through the pages in the report by either clicking on the pages listed below, or by using the keyword search tool below to find specific information within the annual report.-
 1
1 -
2
-
3
-
4
-
5
-
6
-
7
-
8
-
9
-
10
-
11
-
12
-
13
-
14
-
15
-
16
-
17
-
18
-
19
-
20
-
21
-
22
-
23
-
24
-
25
-
26
-
27
-
28
-
29
-
30
-
31
-
32
-
33
-
34
-
35
-
36
-
37
-
38
-
39
-
40
-
41
-
42
-
43
-
44
-
45
-
46
-
47
-
48
-
49
-
50
-
51
-
52
-
53
-
54
-
55
-
56
-
57
-
58
-
59
-
60
-
61
-
62
-
63
-
64
-
65
-
66
-
67
-
68
-
69
-
70
-
71
-
72
-
73
-
74
-
75
-
76
-
77
-
78
-
79
-
80
-
81
-
82
-
83
-
84
-
85
-
86
-
87
-
88
-
89
-
90
-
91
-
92
-
93
-
94
-
95
-
96
-
97
-
98
-
99
-
100
-
101
-
102
-
103
-
104
-
105
-
106
-
107
-
108
-
109
-
110
-
111
-
112
-
113
-
114
-
115
-
116
-
117
-
118
-
119
-
120
-
121
-
122
-
123
-
124
-
 125
125 -
 126
126 -
 127
127 -
 128
128 -
 129
129 -
 130
130 -
 131
131 -
 132
132 -
 133
133 -
 134
134 -
 135
135 -
 136
136 -
 137
137 -
 138
138 -
 139
139 -
 140
140 -
 141
141 -
 142
142 -
 143
143 -
 144
144 -
 145
145 -
146
-
147
-
148
-
149
-
150
-
151
-
152
-
153
-
154
-
155
-
156
-
157
-
158
-
159
-
160
-
161
-
162
-
163
-
164
-
165
-
166
-
167
-
168
-
169
-
170
-
171
-
172
-
173
-
174
-
175
-
176
-
177
-
178
-
179
-
180
-
181
-
182
-
183
-
184
-
185
-
186
-
187
-
188
-
189
-
190
-
191
-
192
-
193
-
194
-
195
-
196
-
197
-
198
-
199
-
200
-
201
-
202
-
203
-
204
-
205
-
206
-
207
-
208
-
209
-
210
-
211
-
212
-
213
-
214
-
215
-
216
-
217
-
218
-
219
-
220
-
221
-
222
-
223
-
224
-
225
-
226
-
227
-
228
-
229
-
230
-
231
-
232
-
233
-
234
-
235
-
236
-
237
-
238
-
239
-
240
-
241
-
242
-
243
-
244
-
245
-
246
-
247
-
248
-
249
-
250
-
251
-
252
-
253
-
254
-
255
-
256
-
257
-
258
-
259
-
260
-
261
-
262
-
263
-
264
-
265
-
266
-
267
-
268
-
269
-
270
-
271
-
272
-
273
-
274
-
275
-
276
-
277
-
278
-
279
-
280
-
281
-
282
-
283
-
284
-
285
-
286
-
287
-
288
-
289
-
290
-
291
-
292
-
293
-
294
-
295
-
296
-
297
-
298
-
299
-
300
-
301
-
302
-
303
-
304
-
305
-
306
-
307
-
308
-
309
-
310
-
311
-
312
-
313
-
314
-
315
-
316
-
317
-
318
-
319
-
320
-
321
-
322
-
323
-
324
-
325
-
326
-
327
-
328
-
329
-
330
-
331
-
332
-
333
-
334
-
335
-
336
 |
 |

Management’s discussion and analysis 135
Management’s discussion and analysis
Financing and Real Estate
Siemens Financial Services (SFS)
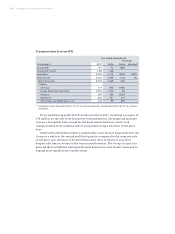
Income before income taxes (IBIT) at SFS rose to €329 million in fi scal 2007
from €306 million in fi scal 2006. The current year benefi ted from gains on sales of
shares in the Equity division and special dividends resulting from divestment
gains by a company in which SFS holds an equity position. IBIT in the prior period
included the special dividend mentioned above. Total assets declined compared to
the end of fi scal 2006, due to a signifi cant reduction in accounts receivable related
to the carve-out of SV and the transfer of carrier activities into NSN.
With respect to the capital structure of SFS, see “Contractual Obligations.”
Siemens Real Estate (SRE)
Income before income taxes at SRE was €228 million in fi scal 2007, compared
to €115 million in the prior year. A year earlier, SRE’s results included signifi cantly
higher vacancy charges and a lower level net gains from real estate disposals.
With respect to the capital structure of SRE, see “Contractual Obligations.”
Eliminations, reclassifi cations and Corporate Treasury
Income before income taxes from eliminations, reclassifi cations and Corporate
Treasury was €153 million in fi scal 2007 compared to a negative €18 million in
fi scal 2006. The difference is due mainly to negative net effects in the prior year
from a mark-to-market valuation of a cash settlement option associated with €2.5
billion of convertible bonds issued in 2003.
Year ended September 30,
(€ in millions) 2007 2006 % Change
Income before income taxes 329 306 8%
Total assets 8,912 10,543 (15)%
Year ended September 30,
(€ in millions) 2007 2006 % Change
Income before income taxes 228 115 98%
Revenue 1,686 1,705 (1)%
Total assets 3,091 3,221 (4)%