Siemens 2007 Annual Report Download - page 254
Download and view the complete annual report
Please find page 254 of the 2007 Siemens annual report below. You can navigate through the pages in the report by either clicking on the pages listed below, or by using the keyword search tool below to find specific information within the annual report.-
 1
1 -
2
-
3
-
4
-
5
-
6
-
7
-
8
-
9
-
10
-
11
-
12
-
13
-
14
-
15
-
16
-
17
-
18
-
19
-
20
-
21
-
22
-
23
-
24
-
25
-
26
-
27
-
28
-
29
-
30
-
31
-
32
-
33
-
34
-
35
-
36
-
37
-
38
-
39
-
40
-
41
-
42
-
43
-
44
-
45
-
46
-
47
-
48
-
49
-
50
-
51
-
52
-
53
-
54
-
55
-
56
-
57
-
58
-
59
-
60
-
61
-
62
-
63
-
64
-
65
-
66
-
67
-
68
-
69
-
70
-
71
-
72
-
73
-
74
-
75
-
76
-
77
-
78
-
79
-
80
-
81
-
82
-
83
-
84
-
85
-
86
-
87
-
88
-
89
-
90
-
91
-
92
-
93
-
94
-
95
-
96
-
97
-
98
-
99
-
100
-
101
-
102
-
103
-
104
-
105
-
106
-
107
-
108
-
109
-
110
-
111
-
112
-
113
-
114
-
115
-
116
-
117
-
118
-
119
-
120
-
121
-
122
-
123
-
124
-
125
-
126
-
127
-
128
-
129
-
130
-
131
-
132
-
133
-
134
-
135
-
136
-
137
-
138
-
139
-
140
-
141
-
142
-
143
-
144
-
145
-
146
-
147
-
148
-
149
-
150
-
151
-
152
-
153
-
154
-
155
-
156
-
157
-
158
-
159
-
160
-
161
-
162
-
163
-
164
-
165
-
166
-
167
-
168
-
169
-
170
-
171
-
172
-
173
-
174
-
175
-
176
-
177
-
178
-
179
-
180
-
181
-
182
-
183
-
184
-
185
-
186
-
187
-
188
-
189
-
190
-
191
-
192
-
193
-
194
-
195
-
196
-
197
-
198
-
199
-
200
-
201
-
202
-
203
-
204
-
205
-
206
-
207
-
208
-
209
-
210
-
211
-
212
-
213
-
214
-
215
-
216
-
217
-
218
-
219
-
220
-
221
-
222
-
223
-
224
-
225
-
226
-
227
-
228
-
229
-
230
-
231
-
232
-
233
-
234
-
235
-
236
-
237
-
238
-
239
-
240
-
241
-
242
-
243
-
 244
244 -
 245
245 -
 246
246 -
 247
247 -
 248
248 -
 249
249 -
 250
250 -
 251
251 -
 252
252 -
 253
253 -
 254
254 -
 255
255 -
 256
256 -
 257
257 -
 258
258 -
 259
259 -
 260
260 -
 261
261 -
 262
262 -
 263
263 -
 264
264 -
265
-
266
-
267
-
268
-
269
-
270
-
271
-
272
-
273
-
274
-
275
-
276
-
277
-
278
-
279
-
280
-
281
-
282
-
283
-
284
-
285
-
286
-
287
-
288
-
289
-
290
-
291
-
292
-
293
-
294
-
295
-
296
-
297
-
298
-
299
-
300
-
301
-
302
-
303
-
304
-
305
-
306
-
307
-
308
-
309
-
310
-
311
-
312
-
313
-
314
-
315
-
316
-
317
-
318
-
319
-
320
-
321
-
322
-
323
-
324
-
325
-
326
-
327
-
328
-
329
-
330
-
331
-
332
-
333
-
334
-
335
-
336
 |
 |

254 Notes to Consolidated Financial Statements
(in millions of €, except where otherwise stated and per share amounts)
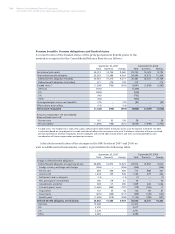
The Consolidated Balance Sheets include the following signifi cant components
related to pension plans and similar commitments based upon the situation as of
September 30, 2007 and 2006:
Consolidated Statements of Income
The recognized expense related to pension plans and similar commitments in the
Consolidated Statements of Income is referred to as net periodic benefi t cost
(NPBC) and consists of several separately calculated and presented components.
NPBC is comprised of the service cost, which is the actuarial net present value of
the part of the DBO for the service rendered in the respective fi scal year; the inter-
est cost for the expense derived from the addition of accrued interest on the DBO
at the end of the preceding fi scal year on the basis of the identifi ed discount rate;
and the expected return on plan assets in the case of funded benefi t plans. Past
service cost is amortized on a straight-line basis over the average vesting period
of the related benefi ts.
In the Consolidated Statements of Income, interest cost and the income from
the expected return on plan assets are reported as part of Financial income
(expense), net. All other components of NPBC are allocated among functional costs
(Cost of goods sold and services rendered, Research and development expenses, Mar-
keting, selling and general administrative expenses), according to the function of
the employee groups accruing benefi ts.
In the Consolidated Statements of Income, NPBC expenses before income taxes
for the Company’s principal pension and other post-employment benefi ts in fi scal
2007 aggregated to €461 compared to €578 in fi scal 2006. Thereof €112 and €130
related to discontinued operations in fi scal 2007 and 2006, respectively.
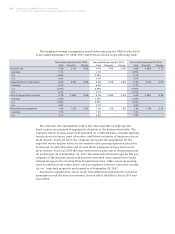
Consolidated Statements of Income and Expense recognized in Equity
Actuarial gains and losses, resulting for example from an adjustment of the dis-
count rate or from a difference between actual and expected return on plan assets,
are recognized in the Consolidated Statements of Income and Expense recognized
in Equity in the year in which they occur. They are recorded in their entirety
directly in equity.
September 30,
2007 2006
Principal pension benefi t plans 1,289 3,054
Principal other post-employment benefi t plans 766 844
Other 1,232 1,566
Reclassifi cation to liabilities associated
with assets classifi ed as held for disposal (507) (381)
Liabilities for pension plans and similar commitments 2,780 5,083
Actuarial (losses)/gains and effects due to asset ceiling 127 (1,379)
Income tax effect (18) 254
Net amount recognized in the Consolidated Statements of
Income and Expense recognized in Equity (net of tax) 109 (1,125)