Siemens 2007 Annual Report Download - page 154
Download and view the complete annual report
Please find page 154 of the 2007 Siemens annual report below. You can navigate through the pages in the report by either clicking on the pages listed below, or by using the keyword search tool below to find specific information within the annual report.-
 1
1 -
2
-
3
-
4
-
5
-
6
-
7
-
8
-
9
-
10
-
11
-
12
-
13
-
14
-
15
-
16
-
17
-
18
-
19
-
20
-
21
-
22
-
23
-
24
-
25
-
26
-
27
-
28
-
29
-
30
-
31
-
32
-
33
-
34
-
35
-
36
-
37
-
38
-
39
-
40
-
41
-
42
-
43
-
44
-
45
-
46
-
47
-
48
-
49
-
50
-
51
-
52
-
53
-
54
-
55
-
56
-
57
-
58
-
59
-
60
-
61
-
62
-
63
-
64
-
65
-
66
-
67
-
68
-
69
-
70
-
71
-
72
-
73
-
74
-
75
-
76
-
77
-
78
-
79
-
80
-
81
-
82
-
83
-
84
-
85
-
86
-
87
-
88
-
89
-
90
-
91
-
92
-
93
-
94
-
95
-
96
-
97
-
98
-
99
-
100
-
101
-
102
-
103
-
104
-
105
-
106
-
107
-
108
-
109
-
110
-
111
-
112
-
113
-
114
-
115
-
116
-
117
-
118
-
119
-
120
-
121
-
122
-
123
-
124
-
125
-
126
-
127
-
128
-
129
-
130
-
131
-
132
-
133
-
134
-
135
-
136
-
137
-
138
-
139
-
140
-
141
-
142
-
143
-
 144
144 -
 145
145 -
 146
146 -
 147
147 -
 148
148 -
 149
149 -
 150
150 -
 151
151 -
 152
152 -
 153
153 -
 154
154 -
 155
155 -
 156
156 -
 157
157 -
 158
158 -
 159
159 -
 160
160 -
 161
161 -
 162
162 -
 163
163 -
 164
164 -
165
-
166
-
167
-
168
-
169
-
170
-
171
-
172
-
173
-
174
-
175
-
176
-
177
-
178
-
179
-
180
-
181
-
182
-
183
-
184
-
185
-
186
-
187
-
188
-
189
-
190
-
191
-
192
-
193
-
194
-
195
-
196
-
197
-
198
-
199
-
200
-
201
-
202
-
203
-
204
-
205
-
206
-
207
-
208
-
209
-
210
-
211
-
212
-
213
-
214
-
215
-
216
-
217
-
218
-
219
-
220
-
221
-
222
-
223
-
224
-
225
-
226
-
227
-
228
-
229
-
230
-
231
-
232
-
233
-
234
-
235
-
236
-
237
-
238
-
239
-
240
-
241
-
242
-
243
-
244
-
245
-
246
-
247
-
248
-
249
-
250
-
251
-
252
-
253
-
254
-
255
-
256
-
257
-
258
-
259
-
260
-
261
-
262
-
263
-
264
-
265
-
266
-
267
-
268
-
269
-
270
-
271
-
272
-
273
-
274
-
275
-
276
-
277
-
278
-
279
-
280
-
281
-
282
-
283
-
284
-
285
-
286
-
287
-
288
-
289
-
290
-
291
-
292
-
293
-
294
-
295
-
296
-
297
-
298
-
299
-
300
-
301
-
302
-
303
-
304
-
305
-
306
-
307
-
308
-
309
-
310
-
311
-
312
-
313
-
314
-
315
-
316
-
317
-
318
-
319
-
320
-
321
-
322
-
323
-
324
-
325
-
326
-
327
-
328
-
329
-
330
-
331
-
332
-
333
-
334
-
335
-
336
 |
 |

154 Management’s discussion and analysis
Overview Financial Position
Our fi nancial position in fi scal 2007 was predominantly infl uenced by the pending
sale of SV, the transfer of the carrier-related operations of the former Group Com
into NSN and the integration of the diagnostics division of Bayer AG and UGS.
The assets and liabilities of SV-related operations of Siemens are classifi ed on the
balance sheet as held for disposal and measured at the lower of their carrying
amount or fair value less costs to sell, due to the pending sale. The assets and lia-
bilities of the carrier-related operations of the former Com Group classifi ed on
September 30, 2006 on the balance sheet as held for disposal have been trans-
ferred into NSN during fi scal 2007, in return the value of the investments
accounted for using the equity method increased. The integration of the Bayer and
UGS businesses during fi scal 2007 increased assets and liabilities, whereas the
acquisitions themselves resulted in signifi cant cash outfl ows. For information on
acquisitions and dispositions and on the carrying amounts of major classes of
assets and liabilities held for disposal, see “Notes to Consolidated Financial State-
ments.”
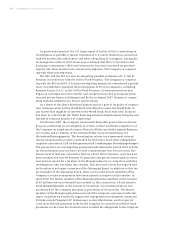
The following table shows current assets at end of fi scal 2007 and fi scal 2006:
Cash and cash equivalents totaled €4.005 billion as of September 30, 2007. The
decrease of €6.209 billion was primarily driven by cash outfl ows associated with
investing activities, in particular due the acquisitions mentioned above. For fur-
ther information, see “Cash Flow-Fiscal 2007 compared to fi scal 2006.”
The decrease in trade and other receivables year-over-year was primarily
driven by reclassifi cation of SV assets in assets held for disposal. Despite the same
reclassifi cation effect for inventories, inventories increased due to the broad
based order growth at Operating Groups and the above-mentioned acquisitions.
Assets classifi ed as held for disposal increased by €4.368 billion. This change
primarily refl ects the transfer of assets of approximately €5 billion of the carrier-
related operations of the former Com Group into NSN during fi scal 2007, and the
reclassifi cation of SV into assets classifi ed as held for disposal of €9 billion.
September 30,
(€ in millions) 2007 2006
Cash and cash equivalents 4,005 10,214
Available-for-sale fi nancial assets 193 596
Trade and other receivables 14,620 15,148
Other current fi nancial assets 2,932 2,370
Inventories 12,930 12,790
Income tax receivables 398 458
Other current assets 1,322 1,274
Assets classifi ed as held for disposal 11,532 7,164
Total current assets 47,932 50,014