Siemens 2007 Annual Report Download - page 133
Download and view the complete annual report
Please find page 133 of the 2007 Siemens annual report below. You can navigate through the pages in the report by either clicking on the pages listed below, or by using the keyword search tool below to find specific information within the annual report.-
 1
1 -
2
-
3
-
4
-
5
-
6
-
7
-
8
-
9
-
10
-
11
-
12
-
13
-
14
-
15
-
16
-
17
-
18
-
19
-
20
-
21
-
22
-
23
-
24
-
25
-
26
-
27
-
28
-
29
-
30
-
31
-
32
-
33
-
34
-
35
-
36
-
37
-
38
-
39
-
40
-
41
-
42
-
43
-
44
-
45
-
46
-
47
-
48
-
49
-
50
-
51
-
52
-
53
-
54
-
55
-
56
-
57
-
58
-
59
-
60
-
61
-
62
-
63
-
64
-
65
-
66
-
67
-
68
-
69
-
70
-
71
-
72
-
73
-
74
-
75
-
76
-
77
-
78
-
79
-
80
-
81
-
82
-
83
-
84
-
85
-
86
-
87
-
88
-
89
-
90
-
91
-
92
-
93
-
94
-
95
-
96
-
97
-
98
-
99
-
100
-
101
-
102
-
103
-
104
-
105
-
106
-
107
-
108
-
109
-
110
-
111
-
112
-
113
-
114
-
115
-
116
-
117
-
118
-
119
-
120
-
121
-
122
-
 123
123 -
 124
124 -
 125
125 -
 126
126 -
 127
127 -
 128
128 -
 129
129 -
 130
130 -
 131
131 -
 132
132 -
 133
133 -
 134
134 -
 135
135 -
 136
136 -
 137
137 -
 138
138 -
 139
139 -
 140
140 -
 141
141 -
 142
142 -
 143
143 -
144
-
145
-
146
-
147
-
148
-
149
-
150
-
151
-
152
-
153
-
154
-
155
-
156
-
157
-
158
-
159
-
160
-
161
-
162
-
163
-
164
-
165
-
166
-
167
-
168
-
169
-
170
-
171
-
172
-
173
-
174
-
175
-
176
-
177
-
178
-
179
-
180
-
181
-
182
-
183
-
184
-
185
-
186
-
187
-
188
-
189
-
190
-
191
-
192
-
193
-
194
-
195
-
196
-
197
-
198
-
199
-
200
-
201
-
202
-
203
-
204
-
205
-
206
-
207
-
208
-
209
-
210
-
211
-
212
-
213
-
214
-
215
-
216
-
217
-
218
-
219
-
220
-
221
-
222
-
223
-
224
-
225
-
226
-
227
-
228
-
229
-
230
-
231
-
232
-
233
-
234
-
235
-
236
-
237
-
238
-
239
-
240
-
241
-
242
-
243
-
244
-
245
-
246
-
247
-
248
-
249
-
250
-
251
-
252
-
253
-
254
-
255
-
256
-
257
-
258
-
259
-
260
-
261
-
262
-
263
-
264
-
265
-
266
-
267
-
268
-
269
-
270
-
271
-
272
-
273
-
274
-
275
-
276
-
277
-
278
-
279
-
280
-
281
-
282
-
283
-
284
-
285
-
286
-
287
-
288
-
289
-
290
-
291
-
292
-
293
-
294
-
295
-
296
-
297
-
298
-
299
-
300
-
301
-
302
-
303
-
304
-
305
-
306
-
307
-
308
-
309
-
310
-
311
-
312
-
313
-
314
-
315
-
316
-
317
-
318
-
319
-
320
-
321
-
322
-
323
-
324
-
325
-
326
-
327
-
328
-
329
-
330
-
331
-
332
-
333
-
334
-
335
-
336
 |
 |

Management’s discussion and analysis 133
Management’s discussion and analysis
Strategic Equity Investments (SEI)
SEI includes results at equity from three companies in which Siemens holds a stra-
tegic equity stake: Nokia Siemens Networks B.V. (NSN), BSH Bosch und Siemens
Hausgeräte GmbH (BSH), and Fujitsu Siemens Computers (Holding) B.V. (FSC). In
fi scal 2006, before NSN became part of SEI, equity investment income related to
BSH and FSC was €225 million. In fi scal 2007, equity investment income related to
BSH and FHC increased to €268 million. In contrast, NSN took €991 million in
charges including €646 million for severance. As a result, Siemens’ equity invest-
ment income related to NSN was a negative €429 million, and fi scal 2007 equity
investment income for SEI overall was a negative €161 million.
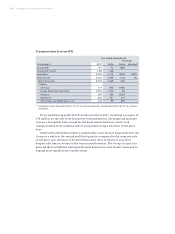
Other Operations
Other Operations consist of centrally held operating businesses not related to a
Group, including Siemens Home and Offi ce Communication Devices (SHC) and, in
fi scal 2006, the distribution and industry logistics (Dematic) businesses carved
out of the former Logistics and Assembly Systems Group. Other Operations
improved to a negative €193 million in fi scal 2007 compared to a negative €317
million in fi scal 2006, when the Dematic business lost €159 million and SHC also
posted a negative result. In fi scal 2007, SHC turned its business around and con-
tributed €13 million in profi t for the year. Centrally carried regional costs not
allocated to the Groups totaled €96 million in the current period, up from €59 mil-
lion in the prior year. In addition, fi scal 2007 included an impairment of €52 mil-
lion at a regional payphone company in Europe. Revenue for Other Operations for
fi scal 2007 was €2.884 billion, down from €3.944 billion a year earlier primarily
due to the Dematic divestment. Within these totals, revenue at SHC remained sta-
ble near €790 million.
Reconciliation to Financial Statements
Reconciliation to fi nancial statements includes various categories of items, which
are not allocated to the Groups because the Managing Board has determined that
such items are not indicative of the performance of the individual Groups.