Siemens 2007 Annual Report Download - page 265
Download and view the complete annual report
Please find page 265 of the 2007 Siemens annual report below. You can navigate through the pages in the report by either clicking on the pages listed below, or by using the keyword search tool below to find specific information within the annual report.-
 1
1 -
2
-
3
-
4
-
5
-
6
-
7
-
8
-
9
-
10
-
11
-
12
-
13
-
14
-
15
-
16
-
17
-
18
-
19
-
20
-
21
-
22
-
23
-
24
-
25
-
26
-
27
-
28
-
29
-
30
-
31
-
32
-
33
-
34
-
35
-
36
-
37
-
38
-
39
-
40
-
41
-
42
-
43
-
44
-
45
-
46
-
47
-
48
-
49
-
50
-
51
-
52
-
53
-
54
-
55
-
56
-
57
-
58
-
59
-
60
-
61
-
62
-
63
-
64
-
65
-
66
-
67
-
68
-
69
-
70
-
71
-
72
-
73
-
74
-
75
-
76
-
77
-
78
-
79
-
80
-
81
-
82
-
83
-
84
-
85
-
86
-
87
-
88
-
89
-
90
-
91
-
92
-
93
-
94
-
95
-
96
-
97
-
98
-
99
-
100
-
101
-
102
-
103
-
104
-
105
-
106
-
107
-
108
-
109
-
110
-
111
-
112
-
113
-
114
-
115
-
116
-
117
-
118
-
119
-
120
-
121
-
122
-
123
-
124
-
125
-
126
-
127
-
128
-
129
-
130
-
131
-
132
-
133
-
134
-
135
-
136
-
137
-
138
-
139
-
140
-
141
-
142
-
143
-
144
-
145
-
146
-
147
-
148
-
149
-
150
-
151
-
152
-
153
-
154
-
155
-
156
-
157
-
158
-
159
-
160
-
161
-
162
-
163
-
164
-
165
-
166
-
167
-
168
-
169
-
170
-
171
-
172
-
173
-
174
-
175
-
176
-
177
-
178
-
179
-
180
-
181
-
182
-
183
-
184
-
185
-
186
-
187
-
188
-
189
-
190
-
191
-
192
-
193
-
194
-
195
-
196
-
197
-
198
-
199
-
200
-
201
-
202
-
203
-
204
-
205
-
206
-
207
-
208
-
209
-
210
-
211
-
212
-
213
-
214
-
215
-
216
-
217
-
218
-
219
-
220
-
221
-
222
-
223
-
224
-
225
-
226
-
227
-
228
-
229
-
230
-
231
-
232
-
233
-
234
-
235
-
236
-
237
-
238
-
239
-
240
-
241
-
242
-
243
-
244
-
245
-
246
-
247
-
248
-
249
-
250
-
251
-
252
-
253
-
254
-
 255
255 -
 256
256 -
 257
257 -
 258
258 -
 259
259 -
 260
260 -
 261
261 -
 262
262 -
 263
263 -
 264
264 -
 265
265 -
 266
266 -
 267
267 -
 268
268 -
 269
269 -
 270
270 -
 271
271 -
 272
272 -
 273
273 -
 274
274 -
 275
275 -
276
-
277
-
278
-
279
-
280
-
281
-
282
-
283
-
284
-
285
-
286
-
287
-
288
-
289
-
290
-
291
-
292
-
293
-
294
-
295
-
296
-
297
-
298
-
299
-
300
-
301
-
302
-
303
-
304
-
305
-
306
-
307
-
308
-
309
-
310
-
311
-
312
-
313
-
314
-
315
-
316
-
317
-
318
-
319
-
320
-
321
-
322
-
323
-
324
-
325
-
326
-
327
-
328
-
329
-
330
-
331
-
332
-
333
-
334
-
335
-
336
 |
 |

Notes to Consolidated Financial Statements 265
(in millions of €, except where otherwise stated and per share amounts)
Notes to Consolidated Financial Statements
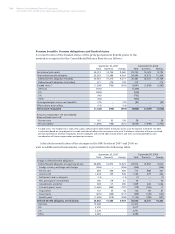
Other post-employment benefi ts: Plan assets
The following table shows the change in plan assets for fi scal 2007 and 2006:
Other post-employment benefi ts: Components of NPBC
The components of the NPBC for other post-employment benefi ts for the years
ended September 30, 2007 and 2006 are as follows:
Other post-employment benefi ts: Amounts recognized in the Consolidated
Statements of Income and Expense recognized in Equity
The actuarial gains and losses on other post-employment benefi t plans recog-
nized in the Consolidated Statements of Income and Expense recognized in Equity
for the fi scal years ended September 30, 2007 and 2006 were as follows:
September 30, 2007 September 30, 2006
Total Domestic Foreign Total Domestic Foreign
Change in plan assets:
Fair value of plan assets at beginning of year 3 – 3 3 – 3
Employer contributions 37 – 37 38 – 38
Benefi ts paid (37) – (37) (38) – (38)
Fair value of plan assets at year end 3 – 3 3 – 3
Year ended September 30, 2007 Year ended September 30, 2006
Total Domestic Foreign Total Domestic Foreign
Service cost 24 12 12 26 15 11
Interest cost 42 16 26 45 18 27
Amortization of unrecognized
past service cost (benefi ts) – – – (1) – (1)
Net periodic benefi t cost 66 28 38 70 33 37
Year ended September 30, 2007 Year ended September 30, 2006
Total Domestic Foreign Total Domestic Foreign
Actuarial losses (gains) (33) (36) 3 (14) 4 (18)
Income tax effect 10 11 (1) 4 (3) 7
Net amount recognized in the Consolidated
Statements of Income and Expense recognized
in Equity (net of tax) (23) (25) 2 (10) 1 (11)
Germany (25) 1
U.S. 3 (11)
Canada (1) –