Siemens 2007 Annual Report Download - page 208
Download and view the complete annual report
Please find page 208 of the 2007 Siemens annual report below. You can navigate through the pages in the report by either clicking on the pages listed below, or by using the keyword search tool below to find specific information within the annual report.-
 1
1 -
2
-
3
-
4
-
5
-
6
-
7
-
8
-
9
-
10
-
11
-
12
-
13
-
14
-
15
-
16
-
17
-
18
-
19
-
20
-
21
-
22
-
23
-
24
-
25
-
26
-
27
-
28
-
29
-
30
-
31
-
32
-
33
-
34
-
35
-
36
-
37
-
38
-
39
-
40
-
41
-
42
-
43
-
44
-
45
-
46
-
47
-
48
-
49
-
50
-
51
-
52
-
53
-
54
-
55
-
56
-
57
-
58
-
59
-
60
-
61
-
62
-
63
-
64
-
65
-
66
-
67
-
68
-
69
-
70
-
71
-
72
-
73
-
74
-
75
-
76
-
77
-
78
-
79
-
80
-
81
-
82
-
83
-
84
-
85
-
86
-
87
-
88
-
89
-
90
-
91
-
92
-
93
-
94
-
95
-
96
-
97
-
98
-
99
-
100
-
101
-
102
-
103
-
104
-
105
-
106
-
107
-
108
-
109
-
110
-
111
-
112
-
113
-
114
-
115
-
116
-
117
-
118
-
119
-
120
-
121
-
122
-
123
-
124
-
125
-
126
-
127
-
128
-
129
-
130
-
131
-
132
-
133
-
134
-
135
-
136
-
137
-
138
-
139
-
140
-
141
-
142
-
143
-
144
-
145
-
146
-
147
-
148
-
149
-
150
-
151
-
152
-
153
-
154
-
155
-
156
-
157
-
158
-
159
-
160
-
161
-
162
-
163
-
164
-
165
-
166
-
167
-
168
-
169
-
170
-
171
-
172
-
173
-
174
-
175
-
176
-
177
-
178
-
179
-
180
-
181
-
182
-
183
-
184
-
185
-
186
-
187
-
188
-
189
-
190
-
191
-
192
-
193
-
194
-
195
-
196
-
197
-
 198
198 -
 199
199 -
 200
200 -
 201
201 -
 202
202 -
 203
203 -
 204
204 -
 205
205 -
 206
206 -
 207
207 -
 208
208 -
 209
209 -
 210
210 -
 211
211 -
 212
212 -
 213
213 -
 214
214 -
 215
215 -
 216
216 -
 217
217 -
 218
218 -
219
-
220
-
221
-
222
-
223
-
224
-
225
-
226
-
227
-
228
-
229
-
230
-
231
-
232
-
233
-
234
-
235
-
236
-
237
-
238
-
239
-
240
-
241
-
242
-
243
-
244
-
245
-
246
-
247
-
248
-
249
-
250
-
251
-
252
-
253
-
254
-
255
-
256
-
257
-
258
-
259
-
260
-
261
-
262
-
263
-
264
-
265
-
266
-
267
-
268
-
269
-
270
-
271
-
272
-
273
-
274
-
275
-
276
-
277
-
278
-
279
-
280
-
281
-
282
-
283
-
284
-
285
-
286
-
287
-
288
-
289
-
290
-
291
-
292
-
293
-
294
-
295
-
296
-
297
-
298
-
299
-
300
-
301
-
302
-
303
-
304
-
305
-
306
-
307
-
308
-
309
-
310
-
311
-
312
-
313
-
314
-
315
-
316
-
317
-
318
-
319
-
320
-
321
-
322
-
323
-
324
-
325
-
326
-
327
-
328
-
329
-
330
-
331
-
332
-
333
-
334
-
335
-
336
 |
 |

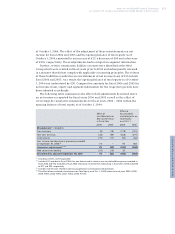
208 Notes to Consolidated Financial Statements
Segment Information (continuing operations)
As of and for the fi scal years ended September 30, 2007 and 2006 (in millions of €)
(1) Group profi t of the Operations Groups is earnings before fi nancing interest,
certain pension costs and income taxes and may exclude other categories
of items which are not allocated to the Groups since the Managing Board
does not regard such items as indicative of the Group’s performance.
(2) Net capital employed of the Operations Groups represents total assets less
tax assets, provisions and non-interest bearing liabilities other than tax
liabilities.
(3) Free cash fl ow represents net cash provided by (used in) operating activities
less additions to intangible assets and property, plant and equipment.
(4) Amortization and impairments of intangible assets other than goodwill and
depreciation and impairments of property, plant and equipment. Goodwill
impairment and impairment of non-current available-for-sale fi nancial
assets and investments accounted for under the equity method for Siemens
amount to €158 and €89 for the fi scal years ended September 30, 2007
and 2006, respectively.
(5) SIS was created effective April 1, 2007 and consists primarily of the activities
of the former segment Siemens Business Services that were bundled with
other information technology (IT) activities. Prior-year information was
reclassifi ed for comparability purposes.
(6) SEI was created as of October 1, 2006 and includes certain strategic invest-
ments accounted for using the equity method. Beginning in the third quarter
of fi scal 2007, the Siemens investment in Nokia Siemens Networks is also
reported in SEI.
(7) Includes cash paid for income taxes according to the allocation of income
taxes to Operations, Financing and Real Estate, and Eliminations,
reclassifi cations and Corporate Treasury in the Consolidated Statements
of Income. Furthermore, the reclassifi cation of interest payments in
the Consolidated Statements of Cash Flow from operating activities into
fi nancing activities is shown in Eliminations. Interest payments are
external interest paid as well as intragroup interest paid and received.
New orders
(unaudited) External revenue
Intersegment
revenue Total revenue
2007 2006 2007 2006 2007 2006 2007 2006
Operations Groups
Siemens IT Solutions and Services (SIS)(5) 5,156 5,574 3,988 4,466 1,372 1,227 5,360 5,693
Automation and Drives (A&D) 16,794 14,312 13,695 11,564 1,694 1,477 15,389 13,041
Industrial Solutions and Services (I&S) 10,161 9,025 7,824 7,837 1,070 982 8,894 8,819
Siemens Building Technologies (SBT) 5,350 5,235 4,952 4,695 110 101 5,062 4,796
Power Generation (PG) 17,988 12,532 12,159 10,068 35 18 12,194 10,086
Power Transmission and Distribution (PTD) 9,896 8,028 7,126 6,032 563 477 7,689 6,509
Transportation Systems (TS) 4,780 6,173 4,418 4,429 34 64 4,452 4,493
Medical Solutions (Med) 10,271 9,334 9,798 8,164 53 63 9,851 8,227
Osram 4,690 4,563 4,677 4,547 13 16 4,690 4,563
Strategic Equity Investments (SEI)(6) – – – – – – – –
Other Operations 2,830 4,068 2,516 3,427 368 517 2,884 3,944
Total Operations Groups 87,916 78,844 71,153 65,229 5,312 4,942 76,465 70,171
Reconciliation to fi nancial statements
Corporate items, pensions and eliminations (4,949) (4,855) 166 97 (5,078) (4,692) (4,912) (4,595)
Other interest expense – – – – – – – –
Other assets related and miscellaneous
reconciling items – – – – – – – –
Total Operations (for columns Group
profi t/Net capital employed, i.e. Income
before income taxes/Total assets) 82,967 73,989 71,319 65,326 234 250 71,553 65,576
Financing and Real Estate Groups
Siemens Financial Services (SFS) 721 645 653 581 67 64 720 645
Siemens Real Estate (SRE) 1,686 1,705 476 580 1,210 1,125 1,686 1,705
Eliminations (13) (10) – – (13) (10) (13) (10)
Total Financing and Real Estate 2,394 2,340 1,129 1,161 1,264 1,179 2,393 2,340
Eliminations, reclassifi cations
and Corporate Treasury (1,445) (1,385) – – (1,498) (1,429) (1,498) (1,429)
Siemens 83,916 74,944 72,448 66,487 – – 72,448 66,487