Siemens 2007 Annual Report Download - page 307
Download and view the complete annual report
Please find page 307 of the 2007 Siemens annual report below. You can navigate through the pages in the report by either clicking on the pages listed below, or by using the keyword search tool below to find specific information within the annual report.-
 1
1 -
2
-
3
-
4
-
5
-
6
-
7
-
8
-
9
-
10
-
11
-
12
-
13
-
14
-
15
-
16
-
17
-
18
-
19
-
20
-
21
-
22
-
23
-
24
-
25
-
26
-
27
-
28
-
29
-
30
-
31
-
32
-
33
-
34
-
35
-
36
-
37
-
38
-
39
-
40
-
41
-
42
-
43
-
44
-
45
-
46
-
47
-
48
-
49
-
50
-
51
-
52
-
53
-
54
-
55
-
56
-
57
-
58
-
59
-
60
-
61
-
62
-
63
-
64
-
65
-
66
-
67
-
68
-
69
-
70
-
71
-
72
-
73
-
74
-
75
-
76
-
77
-
78
-
79
-
80
-
81
-
82
-
83
-
84
-
85
-
86
-
87
-
88
-
89
-
90
-
91
-
92
-
93
-
94
-
95
-
96
-
97
-
98
-
99
-
100
-
101
-
102
-
103
-
104
-
105
-
106
-
107
-
108
-
109
-
110
-
111
-
112
-
113
-
114
-
115
-
116
-
117
-
118
-
119
-
120
-
121
-
122
-
123
-
124
-
125
-
126
-
127
-
128
-
129
-
130
-
131
-
132
-
133
-
134
-
135
-
136
-
137
-
138
-
139
-
140
-
141
-
142
-
143
-
144
-
145
-
146
-
147
-
148
-
149
-
150
-
151
-
152
-
153
-
154
-
155
-
156
-
157
-
158
-
159
-
160
-
161
-
162
-
163
-
164
-
165
-
166
-
167
-
168
-
169
-
170
-
171
-
172
-
173
-
174
-
175
-
176
-
177
-
178
-
179
-
180
-
181
-
182
-
183
-
184
-
185
-
186
-
187
-
188
-
189
-
190
-
191
-
192
-
193
-
194
-
195
-
196
-
197
-
198
-
199
-
200
-
201
-
202
-
203
-
204
-
205
-
206
-
207
-
208
-
209
-
210
-
211
-
212
-
213
-
214
-
215
-
216
-
217
-
218
-
219
-
220
-
221
-
222
-
223
-
224
-
225
-
226
-
227
-
228
-
229
-
230
-
231
-
232
-
233
-
234
-
235
-
236
-
237
-
238
-
239
-
240
-
241
-
242
-
243
-
244
-
245
-
246
-
247
-
248
-
249
-
250
-
251
-
252
-
253
-
254
-
255
-
256
-
257
-
258
-
259
-
260
-
261
-
262
-
263
-
264
-
265
-
266
-
267
-
268
-
269
-
270
-
271
-
272
-
273
-
274
-
275
-
276
-
277
-
278
-
279
-
280
-
281
-
282
-
283
-
284
-
285
-
286
-
287
-
288
-
289
-
290
-
291
-
292
-
293
-
294
-
295
-
296
-
 297
297 -
 298
298 -
 299
299 -
 300
300 -
 301
301 -
 302
302 -
 303
303 -
 304
304 -
 305
305 -
 306
306 -
 307
307 -
 308
308 -
 309
309 -
 310
310 -
 311
311 -
 312
312 -
 313
313 -
 314
314 -
 315
315 -
 316
316 -
 317
317 -
318
-
319
-
320
-
321
-
322
-
323
-
324
-
325
-
326
-
327
-
328
-
329
-
330
-
331
-
332
-
333
-
334
-
335
-
336
 |
 |

Notes to Consolidated Financial Statements 307
(in millions of €, except where otherwise stated and per share amounts)
Notes to Consolidated Financial Statements
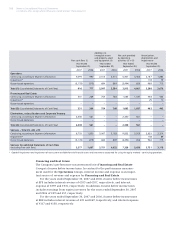
34 Personnel costs
Expenses relating to pension plans and employee benefi ts includes service cost
for the period. Expected return on plan assets and interest cost are included in
Financial income (expense), net.
The average number of employees in fi scal year 2007 and 2006 was 386,200
and 368,500, respectively (based on continuing operations). Part-time employees
are included on a proportionate basis rather than being counted as full units. The
employees were engaged in the following activities:
35 Earnings per share
For additional information on the convertible debt see also Notes 22 and 26.
Year ended
September 30,
2007 2006
Wages and salaries 18,631 18,719
Statutory social welfare contributions and expenses
for optional support payments 3,076 3,064
Expenses relating to pension plans and employee benefi ts 818 1,007
22,525 22,790
Year ended
September 30,
(in thousands) 2007 2006
Manufacturing and services 237.2 221.8
Sales and marketing 84.2 85.0
Research and development 30.9 26.4
Administration and general services 33.9 35.3
386.2 368.5
Year ended
September 30,
(shares in thousands) 2007 2006
Income from continuing operations 3,909 2,642
Less: Portion attributable to minority interest (199) (167)
Income from continuing operations attributable
to shareholders of Siemens AG 3,710 2,475
Plus: Effect of assumed conversion, net of tax 26 –
Income from continuing operations attributable
to shareholders of Siemens AG plus effect of assumed conversion 3,736 2,475
Weighted average shares outstanding – basic 898,135 890,850
Effect of dilutive convertible debt securities
and share-based payment 37,035 2,292
Weighted average shares outstanding – diluted 935,170 893,142
Basic earnings per share (from continuing operations) 4.13 2.78
Diluted earnings per share (from continuing operations) 3.99 2.77