Siemens 2007 Annual Report Download - page 132
Download and view the complete annual report
Please find page 132 of the 2007 Siemens annual report below. You can navigate through the pages in the report by either clicking on the pages listed below, or by using the keyword search tool below to find specific information within the annual report.-
 1
1 -
2
-
3
-
4
-
5
-
6
-
7
-
8
-
9
-
10
-
11
-
12
-
13
-
14
-
15
-
16
-
17
-
18
-
19
-
20
-
21
-
22
-
23
-
24
-
25
-
26
-
27
-
28
-
29
-
30
-
31
-
32
-
33
-
34
-
35
-
36
-
37
-
38
-
39
-
40
-
41
-
42
-
43
-
44
-
45
-
46
-
47
-
48
-
49
-
50
-
51
-
52
-
53
-
54
-
55
-
56
-
57
-
58
-
59
-
60
-
61
-
62
-
63
-
64
-
65
-
66
-
67
-
68
-
69
-
70
-
71
-
72
-
73
-
74
-
75
-
76
-
77
-
78
-
79
-
80
-
81
-
82
-
83
-
84
-
85
-
86
-
87
-
88
-
89
-
90
-
91
-
92
-
93
-
94
-
95
-
96
-
97
-
98
-
99
-
100
-
101
-
102
-
103
-
104
-
105
-
106
-
107
-
108
-
109
-
110
-
111
-
112
-
113
-
114
-
115
-
116
-
117
-
118
-
119
-
120
-
121
-
 122
122 -
 123
123 -
 124
124 -
 125
125 -
 126
126 -
 127
127 -
 128
128 -
 129
129 -
 130
130 -
 131
131 -
 132
132 -
 133
133 -
 134
134 -
 135
135 -
 136
136 -
 137
137 -
 138
138 -
 139
139 -
 140
140 -
 141
141 -
 142
142 -
143
-
144
-
145
-
146
-
147
-
148
-
149
-
150
-
151
-
152
-
153
-
154
-
155
-
156
-
157
-
158
-
159
-
160
-
161
-
162
-
163
-
164
-
165
-
166
-
167
-
168
-
169
-
170
-
171
-
172
-
173
-
174
-
175
-
176
-
177
-
178
-
179
-
180
-
181
-
182
-
183
-
184
-
185
-
186
-
187
-
188
-
189
-
190
-
191
-
192
-
193
-
194
-
195
-
196
-
197
-
198
-
199
-
200
-
201
-
202
-
203
-
204
-
205
-
206
-
207
-
208
-
209
-
210
-
211
-
212
-
213
-
214
-
215
-
216
-
217
-
218
-
219
-
220
-
221
-
222
-
223
-
224
-
225
-
226
-
227
-
228
-
229
-
230
-
231
-
232
-
233
-
234
-
235
-
236
-
237
-
238
-
239
-
240
-
241
-
242
-
243
-
244
-
245
-
246
-
247
-
248
-
249
-
250
-
251
-
252
-
253
-
254
-
255
-
256
-
257
-
258
-
259
-
260
-
261
-
262
-
263
-
264
-
265
-
266
-
267
-
268
-
269
-
270
-
271
-
272
-
273
-
274
-
275
-
276
-
277
-
278
-
279
-
280
-
281
-
282
-
283
-
284
-
285
-
286
-
287
-
288
-
289
-
290
-
291
-
292
-
293
-
294
-
295
-
296
-
297
-
298
-
299
-
300
-
301
-
302
-
303
-
304
-
305
-
306
-
307
-
308
-
309
-
310
-
311
-
312
-
313
-
314
-
315
-
316
-
317
-
318
-
319
-
320
-
321
-
322
-
323
-
324
-
325
-
326
-
327
-
328
-
329
-
330
-
331
-
332
-
333
-
334
-
335
-
336
 |
 |

132 Management’s discussion and analysis
Siemens IT Solutions and Services (SIS)
Fiscal 2007 was the fi rst year of operation for SIS, which combines the former
Siemens Business Services (SBS) Group with the four software development enti-
ties Program and System Engineering (PSE), Siemens Information Systems Ltd.
(SISL), Development Innovation and Projects (DIP) and the Business Innovation
Center (BIC). Results for SIS are presented on a retroactive basis, to provide a
meaningful comparison with prior periods.
Group profi t of €252 million resulted largely from a signifi cantly improved
cost structure at SIS, following severance programs in prior-years, which in fi scal
2006 resulted in severance charges of €576 million. The severance charges were a
major factor in the Group’s loss of €731 million in fi scal 2006. Furthermore Group
profi t in fi scal 2007 benefi ted from more selective order intake. Equity investment
income of €10 million in fi scal 2007 includes equity income related to BWI Infor-
mationstechnik GmbH, which has been set up in connection with the “HERKULES”
project to modernize and manage the non-military information and communica-
tions technology of the German Federal Armed Forces. For additional information
with respect to HERKULES, see “Notes to Consolidated Financial Statements.”
Revenue and orders of €5.360 billion and €5.156 billion, respectively, came in
lower than the prior-year totals due to the divestment of the Group’s Product
Related Services (PRS) business halfway through fi scal 2006. For additional infor-
mation with respect to the PRS divestment, see “Notes to Consolidated Financial
Statements.” On an organic basis, revenue and orders were up 5% year-over-year.
The percentage of the business volume conducted within Siemens rose to 26%
from 22% in fi scal 2006. Externally, SIS conducted a large majority of its business
in Europe (including Germany) in both years.
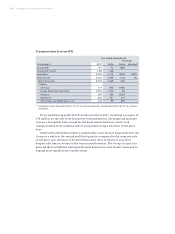
Year ended September 30,
% Change
(€ in millions) 2007 2006 Actual Adjusted*
Group profi t 252 (731)
Group profi t margin 4.7% (12.8)%
New orders 5,156 5,574 (7)% 5%
Total revenue 5,360 5,693 (6)% 5%
External revenue 3,988 4,466 (11)%
Therein:
Germany 1,498 1,788 (16)%
Europe (other than Germany) 1,854 2,014 (8)%
Americas 472 505 (7)%
Asia-Pacifi c 98 75 31%
Africa, Near and Middle East, C.I.S. 66 84 (21)%
* Excluding currency translation effects of (1)% on revenue and orders, and portfolio effects of (10)% and (11)%
on revenue and orders, respectively.