Siemens 2007 Annual Report Download - page 125
Download and view the complete annual report
Please find page 125 of the 2007 Siemens annual report below. You can navigate through the pages in the report by either clicking on the pages listed below, or by using the keyword search tool below to find specific information within the annual report.-
 1
1 -
2
-
3
-
4
-
5
-
6
-
7
-
8
-
9
-
10
-
11
-
12
-
13
-
14
-
15
-
16
-
17
-
18
-
19
-
20
-
21
-
22
-
23
-
24
-
25
-
26
-
27
-
28
-
29
-
30
-
31
-
32
-
33
-
34
-
35
-
36
-
37
-
38
-
39
-
40
-
41
-
42
-
43
-
44
-
45
-
46
-
47
-
48
-
49
-
50
-
51
-
52
-
53
-
54
-
55
-
56
-
57
-
58
-
59
-
60
-
61
-
62
-
63
-
64
-
65
-
66
-
67
-
68
-
69
-
70
-
71
-
72
-
73
-
74
-
75
-
76
-
77
-
78
-
79
-
80
-
81
-
82
-
83
-
84
-
85
-
86
-
87
-
88
-
89
-
90
-
91
-
92
-
93
-
94
-
95
-
96
-
97
-
98
-
99
-
100
-
101
-
102
-
103
-
104
-
105
-
106
-
107
-
108
-
109
-
110
-
111
-
112
-
113
-
114
-
 115
115 -
 116
116 -
 117
117 -
 118
118 -
 119
119 -
 120
120 -
 121
121 -
 122
122 -
 123
123 -
 124
124 -
 125
125 -
 126
126 -
 127
127 -
 128
128 -
 129
129 -
 130
130 -
 131
131 -
 132
132 -
 133
133 -
 134
134 -
 135
135 -
136
-
137
-
138
-
139
-
140
-
141
-
142
-
143
-
144
-
145
-
146
-
147
-
148
-
149
-
150
-
151
-
152
-
153
-
154
-
155
-
156
-
157
-
158
-
159
-
160
-
161
-
162
-
163
-
164
-
165
-
166
-
167
-
168
-
169
-
170
-
171
-
172
-
173
-
174
-
175
-
176
-
177
-
178
-
179
-
180
-
181
-
182
-
183
-
184
-
185
-
186
-
187
-
188
-
189
-
190
-
191
-
192
-
193
-
194
-
195
-
196
-
197
-
198
-
199
-
200
-
201
-
202
-
203
-
204
-
205
-
206
-
207
-
208
-
209
-
210
-
211
-
212
-
213
-
214
-
215
-
216
-
217
-
218
-
219
-
220
-
221
-
222
-
223
-
224
-
225
-
226
-
227
-
228
-
229
-
230
-
231
-
232
-
233
-
234
-
235
-
236
-
237
-
238
-
239
-
240
-
241
-
242
-
243
-
244
-
245
-
246
-
247
-
248
-
249
-
250
-
251
-
252
-
253
-
254
-
255
-
256
-
257
-
258
-
259
-
260
-
261
-
262
-
263
-
264
-
265
-
266
-
267
-
268
-
269
-
270
-
271
-
272
-
273
-
274
-
275
-
276
-
277
-
278
-
279
-
280
-
281
-
282
-
283
-
284
-
285
-
286
-
287
-
288
-
289
-
290
-
291
-
292
-
293
-
294
-
295
-
296
-
297
-
298
-
299
-
300
-
301
-
302
-
303
-
304
-
305
-
306
-
307
-
308
-
309
-
310
-
311
-
312
-
313
-
314
-
315
-
316
-
317
-
318
-
319
-
320
-
321
-
322
-
323
-
324
-
325
-
326
-
327
-
328
-
329
-
330
-
331
-
332
-
333
-
334
-
335
-
336
 |
 |

Management’s discussion and analysis 125
Management’s discussion and analysis
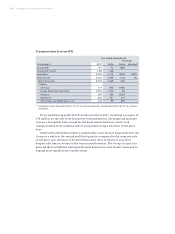
Industrial Solutions and Services (I&S)
In fi scal 2007, Group profi t at I&S climbed to €415 million, a 47% increase year-
over-year. Both earnings and margins improved throughout the Group, with the
strongest increases coming in the Group’s largest businesses: industrial services,
oil and gas and metal technologies. Amortization during fi scal 2007 declined com-
pared to fi scal 2006, primarily on lower PPA effects from acquisitions in prior
years including VA Technologies AG (VA Tech).
Orders at I&S for fi scal 2007 rose to €10.161 billion, 13% higher than in fi scal
2006. This growth was fueled by strong demand in Asia-Pacifi c and the Americas,
including large orders from Brazil and the U.S. While revenue of €8.894 billion
also included healthy growth in Asia-Pacifi c, this was offset somewhat by the
effects of industry-wide resource constraints as well as lower revenue in the
postal automation and airport logistics businesses compared to fi scal 2006.
Year ended September 30,
% Change
(€ in millions) 2007 2006 Actual Adjusted*
Group profi t 415 282 47%
Group profi t margin 4.7% 3.2%
New orders 10,161 9,025 13% 15%
Total revenue 8,894 8,819 1% 3%
External revenue 7,824 7,837 (0)%
Therein:
Germany 1,011 1,011 0%
Europe (other than Germany) 2,178 2,141 2%
Americas 2,359 2,549 (7)%
Asia-Pacifi c 1,364 1,187 15%
Africa, Near and Middle East, C.I.S. 912 949 (4)%
* Excluding currency translation effects of (3)% on revenue and orders, and portfolio effects of 1% on revenue
and orders.