Siemens 2007 Annual Report Download - page 213
Download and view the complete annual report
Please find page 213 of the 2007 Siemens annual report below. You can navigate through the pages in the report by either clicking on the pages listed below, or by using the keyword search tool below to find specific information within the annual report.-
 1
1 -
2
-
3
-
4
-
5
-
6
-
7
-
8
-
9
-
10
-
11
-
12
-
13
-
14
-
15
-
16
-
17
-
18
-
19
-
20
-
21
-
22
-
23
-
24
-
25
-
26
-
27
-
28
-
29
-
30
-
31
-
32
-
33
-
34
-
35
-
36
-
37
-
38
-
39
-
40
-
41
-
42
-
43
-
44
-
45
-
46
-
47
-
48
-
49
-
50
-
51
-
52
-
53
-
54
-
55
-
56
-
57
-
58
-
59
-
60
-
61
-
62
-
63
-
64
-
65
-
66
-
67
-
68
-
69
-
70
-
71
-
72
-
73
-
74
-
75
-
76
-
77
-
78
-
79
-
80
-
81
-
82
-
83
-
84
-
85
-
86
-
87
-
88
-
89
-
90
-
91
-
92
-
93
-
94
-
95
-
96
-
97
-
98
-
99
-
100
-
101
-
102
-
103
-
104
-
105
-
106
-
107
-
108
-
109
-
110
-
111
-
112
-
113
-
114
-
115
-
116
-
117
-
118
-
119
-
120
-
121
-
122
-
123
-
124
-
125
-
126
-
127
-
128
-
129
-
130
-
131
-
132
-
133
-
134
-
135
-
136
-
137
-
138
-
139
-
140
-
141
-
142
-
143
-
144
-
145
-
146
-
147
-
148
-
149
-
150
-
151
-
152
-
153
-
154
-
155
-
156
-
157
-
158
-
159
-
160
-
161
-
162
-
163
-
164
-
165
-
166
-
167
-
168
-
169
-
170
-
171
-
172
-
173
-
174
-
175
-
176
-
177
-
178
-
179
-
180
-
181
-
182
-
183
-
184
-
185
-
186
-
187
-
188
-
189
-
190
-
191
-
192
-
193
-
194
-
195
-
196
-
197
-
198
-
199
-
200
-
201
-
202
-
 203
203 -
 204
204 -
 205
205 -
 206
206 -
 207
207 -
 208
208 -
 209
209 -
 210
210 -
 211
211 -
 212
212 -
 213
213 -
 214
214 -
 215
215 -
 216
216 -
 217
217 -
 218
218 -
 219
219 -
 220
220 -
 221
221 -
 222
222 -
 223
223 -
224
-
225
-
226
-
227
-
228
-
229
-
230
-
231
-
232
-
233
-
234
-
235
-
236
-
237
-
238
-
239
-
240
-
241
-
242
-
243
-
244
-
245
-
246
-
247
-
248
-
249
-
250
-
251
-
252
-
253
-
254
-
255
-
256
-
257
-
258
-
259
-
260
-
261
-
262
-
263
-
264
-
265
-
266
-
267
-
268
-
269
-
270
-
271
-
272
-
273
-
274
-
275
-
276
-
277
-
278
-
279
-
280
-
281
-
282
-
283
-
284
-
285
-
286
-
287
-
288
-
289
-
290
-
291
-
292
-
293
-
294
-
295
-
296
-
297
-
298
-
299
-
300
-
301
-
302
-
303
-
304
-
305
-
306
-
307
-
308
-
309
-
310
-
311
-
312
-
313
-
314
-
315
-
316
-
317
-
318
-
319
-
320
-
321
-
322
-
323
-
324
-
325
-
326
-
327
-
328
-
329
-
330
-
331
-
332
-
333
-
334
-
335
-
336
 |
 |

Notes to Consolidated Financial Statements 213
(in millions of €, except where otherwise stated and per share amounts)
Notes to Consolidated Financial Statements
of October 1, 2004. The effect of the adjustment of these misstatements on net
income for fi scal 2006 and 2005 and the opening balance of total equity as of
October 1, 2004 amounted to an increase of €25, a decrease of €69 and a decrease
of €336, respectively. These adjustments had no impact on segment information.
Further, certain commission liability accounts were identifi ed at the Med
Group which were created in fi scal years prior to 2005 and subsequently released
in a manner that did not comply with applicable accounting principles. The release
of those liabilities resulted in an overstatement of net income (loss) of €15 in both
fi scal 2006 and 2005. As a result, the opening balance of total equity as of October
1, 2004 was understated by €30. Comparative amounts for fi scal 2006 and 2005 for
net income (loss), equity and segment information for the respective periods have
been adjusted accordingly.
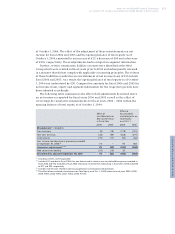
The following table summarizes the effect of all adjustments described above
on net income as reported for fi scal years 2006 and 2005 as well as the effect of
correcting the cumulative misstatements for fi scal years 2000 – 2004 within the
opening balance of total equity as of October 1, 2004:
Effect of
misstatements on
Net income (loss)
in Fiscal Year
Effect of
Accumulated
misstatements on
Total equity
as of Oct. 1,
2006 2005 2004 Total
Misstatement(1), related to
Com Germany (5) (13) (173) (191)
Non-Com Germany (28) (39) (208) (275)
International (15) (17) (50) (82)
Less: Income tax adjustments previously recorded
at September 30, 2006(2) 73 – 95 168
Income tax adjustments(3) (4) 25 (69) (336) (380)
Med commission liability (15) (15) 30 –
Misstatements adjusted September 30, 2007 10 (84) (306) (380)
(1) Including interest, where applicable.
(2) Includes €31 recorded in fi scal 2006 that was determined to relate to non tax deductible expenses recorded in
fi scal 2006 and €42 recorded in fi scal 2006 relating to misstatements originating in fi scal years 2005 and 2004
of €17 and €25, respectively.
(3) Includes income taxes related to continuing operations and discontinued operations.
(4) The effect of accumulated misstatements on Total Equity as of Oct. 1, 2004 relates to fi scal years 2004: €(82);
2003: €(59); 2002: €(55); 2001: €(40); 2000: €(100).