Siemens 2007 Annual Report Download - page 136
Download and view the complete annual report
Please find page 136 of the 2007 Siemens annual report below. You can navigate through the pages in the report by either clicking on the pages listed below, or by using the keyword search tool below to find specific information within the annual report.-
 1
1 -
2
-
3
-
4
-
5
-
6
-
7
-
8
-
9
-
10
-
11
-
12
-
13
-
14
-
15
-
16
-
17
-
18
-
19
-
20
-
21
-
22
-
23
-
24
-
25
-
26
-
27
-
28
-
29
-
30
-
31
-
32
-
33
-
34
-
35
-
36
-
37
-
38
-
39
-
40
-
41
-
42
-
43
-
44
-
45
-
46
-
47
-
48
-
49
-
50
-
51
-
52
-
53
-
54
-
55
-
56
-
57
-
58
-
59
-
60
-
61
-
62
-
63
-
64
-
65
-
66
-
67
-
68
-
69
-
70
-
71
-
72
-
73
-
74
-
75
-
76
-
77
-
78
-
79
-
80
-
81
-
82
-
83
-
84
-
85
-
86
-
87
-
88
-
89
-
90
-
91
-
92
-
93
-
94
-
95
-
96
-
97
-
98
-
99
-
100
-
101
-
102
-
103
-
104
-
105
-
106
-
107
-
108
-
109
-
110
-
111
-
112
-
113
-
114
-
115
-
116
-
117
-
118
-
119
-
120
-
121
-
122
-
123
-
124
-
125
-
 126
126 -
 127
127 -
 128
128 -
 129
129 -
 130
130 -
 131
131 -
 132
132 -
 133
133 -
 134
134 -
 135
135 -
 136
136 -
 137
137 -
 138
138 -
 139
139 -
 140
140 -
 141
141 -
 142
142 -
 143
143 -
 144
144 -
 145
145 -
 146
146 -
147
-
148
-
149
-
150
-
151
-
152
-
153
-
154
-
155
-
156
-
157
-
158
-
159
-
160
-
161
-
162
-
163
-
164
-
165
-
166
-
167
-
168
-
169
-
170
-
171
-
172
-
173
-
174
-
175
-
176
-
177
-
178
-
179
-
180
-
181
-
182
-
183
-
184
-
185
-
186
-
187
-
188
-
189
-
190
-
191
-
192
-
193
-
194
-
195
-
196
-
197
-
198
-
199
-
200
-
201
-
202
-
203
-
204
-
205
-
206
-
207
-
208
-
209
-
210
-
211
-
212
-
213
-
214
-
215
-
216
-
217
-
218
-
219
-
220
-
221
-
222
-
223
-
224
-
225
-
226
-
227
-
228
-
229
-
230
-
231
-
232
-
233
-
234
-
235
-
236
-
237
-
238
-
239
-
240
-
241
-
242
-
243
-
244
-
245
-
246
-
247
-
248
-
249
-
250
-
251
-
252
-
253
-
254
-
255
-
256
-
257
-
258
-
259
-
260
-
261
-
262
-
263
-
264
-
265
-
266
-
267
-
268
-
269
-
270
-
271
-
272
-
273
-
274
-
275
-
276
-
277
-
278
-
279
-
280
-
281
-
282
-
283
-
284
-
285
-
286
-
287
-
288
-
289
-
290
-
291
-
292
-
293
-
294
-
295
-
296
-
297
-
298
-
299
-
300
-
301
-
302
-
303
-
304
-
305
-
306
-
307
-
308
-
309
-
310
-
311
-
312
-
313
-
314
-
315
-
316
-
317
-
318
-
319
-
320
-
321
-
322
-
323
-
324
-
325
-
326
-
327
-
328
-
329
-
330
-
331
-
332
-
333
-
334
-
335
-
336
 |
 |

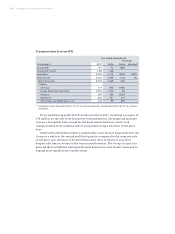
136 Management’s discussion and analysis
Reconciliation from Group profi t /
Income before income taxes to EBITDA (adjusted)
For the fi scal years ended September 30, 2007 and 2006 (in millions of €)
(1) Includes impairments of investments accounted for using the equity method.
(2) Includes impairments of non-current available-for-sale fi nancial assets.
(3) Adjusted EBIT is Income from continuing operations before income taxes less Financial income
(expense), net and Income (loss) from investments accounted for using the equity method, net.
(4) Amortization and impairments of intangible assets other than goodwill.
(5) Includes impairments of goodwill of €60 in fi scal 2007 and – in fi scal 2006.
Group profi t
Income (loss)
from investments
accounted for
using the equity
method, net(1)
2007 2006 2007 2006
Operations Groups
Automation and Drives (A&D) 2,090 1,575 – –
Industrial Solutions and Services (I&S) 415 282 15 9
Siemens Building Technologies (SBT) 354 223 1 2
Osram 492 456 5 1
Transportation Systems (TS) 191 72 1 1
Power Generation (PG) 1,147 779 (2) 36
Power Transmission and Distribution (PTD) 650 315 19 15
Medical Solutions (Med) 1,323 988 60 27
Siemens IT Solutions and Services (SIS) 252 (731) 10 1
Strategic Equity Investments (SEI) (161) 225 (161) 225
Other Operations (193) (317) 24 25
Total Operations Groups 6,560 3,867 (28) 342
Reconciliation to fi nancial statements
Corporate items, pensions and eliminations (1,672) (527) 67 9
Other interest income/expense (497) (325) – –
Total Operations 4,391 3,015 39 351
Income before
income taxes
Financing and Real Estate Groups
Siemens Financial Services (SFS) 329 306 59 57
Siemens Real Estate (SRE) 228 115 10 (4)
Total Financing and Real Estate 557 421 69 53
Eliminations, reclassifi cations and Corporate Treasury 153 (18) – –
Siemens 5,101 3,418 108 404
The following table shows selected topics included in Group profi t and Income
before income taxes as well as a reconciliation to EBITDA (adjusted):