Siemens 2007 Annual Report Download - page 130
Download and view the complete annual report
Please find page 130 of the 2007 Siemens annual report below. You can navigate through the pages in the report by either clicking on the pages listed below, or by using the keyword search tool below to find specific information within the annual report.-
 1
1 -
2
-
3
-
4
-
5
-
6
-
7
-
8
-
9
-
10
-
11
-
12
-
13
-
14
-
15
-
16
-
17
-
18
-
19
-
20
-
21
-
22
-
23
-
24
-
25
-
26
-
27
-
28
-
29
-
30
-
31
-
32
-
33
-
34
-
35
-
36
-
37
-
38
-
39
-
40
-
41
-
42
-
43
-
44
-
45
-
46
-
47
-
48
-
49
-
50
-
51
-
52
-
53
-
54
-
55
-
56
-
57
-
58
-
59
-
60
-
61
-
62
-
63
-
64
-
65
-
66
-
67
-
68
-
69
-
70
-
71
-
72
-
73
-
74
-
75
-
76
-
77
-
78
-
79
-
80
-
81
-
82
-
83
-
84
-
85
-
86
-
87
-
88
-
89
-
90
-
91
-
92
-
93
-
94
-
95
-
96
-
97
-
98
-
99
-
100
-
101
-
102
-
103
-
104
-
105
-
106
-
107
-
108
-
109
-
110
-
111
-
112
-
113
-
114
-
115
-
116
-
117
-
118
-
119
-
 120
120 -
 121
121 -
 122
122 -
 123
123 -
 124
124 -
 125
125 -
 126
126 -
 127
127 -
 128
128 -
 129
129 -
 130
130 -
 131
131 -
 132
132 -
 133
133 -
 134
134 -
 135
135 -
 136
136 -
 137
137 -
 138
138 -
 139
139 -
 140
140 -
141
-
142
-
143
-
144
-
145
-
146
-
147
-
148
-
149
-
150
-
151
-
152
-
153
-
154
-
155
-
156
-
157
-
158
-
159
-
160
-
161
-
162
-
163
-
164
-
165
-
166
-
167
-
168
-
169
-
170
-
171
-
172
-
173
-
174
-
175
-
176
-
177
-
178
-
179
-
180
-
181
-
182
-
183
-
184
-
185
-
186
-
187
-
188
-
189
-
190
-
191
-
192
-
193
-
194
-
195
-
196
-
197
-
198
-
199
-
200
-
201
-
202
-
203
-
204
-
205
-
206
-
207
-
208
-
209
-
210
-
211
-
212
-
213
-
214
-
215
-
216
-
217
-
218
-
219
-
220
-
221
-
222
-
223
-
224
-
225
-
226
-
227
-
228
-
229
-
230
-
231
-
232
-
233
-
234
-
235
-
236
-
237
-
238
-
239
-
240
-
241
-
242
-
243
-
244
-
245
-
246
-
247
-
248
-
249
-
250
-
251
-
252
-
253
-
254
-
255
-
256
-
257
-
258
-
259
-
260
-
261
-
262
-
263
-
264
-
265
-
266
-
267
-
268
-
269
-
270
-
271
-
272
-
273
-
274
-
275
-
276
-
277
-
278
-
279
-
280
-
281
-
282
-
283
-
284
-
285
-
286
-
287
-
288
-
289
-
290
-
291
-
292
-
293
-
294
-
295
-
296
-
297
-
298
-
299
-
300
-
301
-
302
-
303
-
304
-
305
-
306
-
307
-
308
-
309
-
310
-
311
-
312
-
313
-
314
-
315
-
316
-
317
-
318
-
319
-
320
-
321
-
322
-
323
-
324
-
325
-
326
-
327
-
328
-
329
-
330
-
331
-
332
-
333
-
334
-
335
-
336
 |
 |

130 Management’s discussion and analysis
increase the earnings quality of PG’s order backlog as they replace older, lower-
margin orders that are being fulfi lled in coming quarters. Revenue for the year
rose to €12.194 billion, 21% higher than in the prior year. On a regional basis,
Asia-Pacifi c, Europe (outside Germany) and the Americas all contributed rapid
revenue growth for the year. PG closed one acquisition in fi scal 2007 and two
acquisitions in fi scal 2006, each bringing the Group new capabilities for clean
power generation.
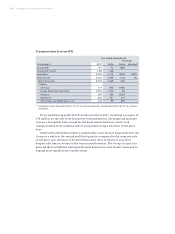
Power Transmission and Distribution (PTD)
PTD’s Group profi t in fi scal 2007 was €650 million, more than double the level
in the prior year. Group profi t margin for the year benefi ted from €25 million in
hedging effects not qualifying for hedge accounting. The prior-year results
included charges related to restructuring programs. Higher revenue in fi scal 2007
led to higher capacity utilization and other operating effi ciencies, which in turn
enabled all divisions within PTD to increase their earnings and margins com-
pared to fi scal 2006.
In a strong global market for secure, high-effi ciency power transmission and
distribution, PTD’s orders increased 23%, to €9.896 billion. The Group’s high-volt-
age direct current (HVDC) technology was a strong driver of large orders during
the year, including contract wins in China, India and the U.S. Revenue rose 18%
year-over-year, to €7.689 billion, with Europe (including Germany), the Americas
and Asia-Pacifi c all posting double-digit increases in revenue to external custom-
ers and external revenue in Africa, Near and Middle East, C.I.S. rose 50% year-
over-year.
Year ended September 30,
% Change
(€ in millions) 2007 2006 Actual Adjusted*
Group profi t 650 315 106%
Group profi t margin 8.5% 4.8%
New orders 9,896 8,028 23% 27%
Total revenue 7,689 6,509 18% 21%
External revenue 7,126 6,032 18%
Therein:
Germany 660 558 18%
Europe (other than Germany) 1,842 1,684 9%
Americas 1,373 1,233 11%
Asia-Pacifi c 1,601 1,457 10%
Africa, Near and Middle East, C.I.S. 1,650 1,100 50%
* Excluding currency translation effects of (3)% and (4)% on revenue and orders, respectively.