Siemens 2007 Annual Report Download - page 124
Download and view the complete annual report
Please find page 124 of the 2007 Siemens annual report below. You can navigate through the pages in the report by either clicking on the pages listed below, or by using the keyword search tool below to find specific information within the annual report.-
 1
1 -
2
-
3
-
4
-
5
-
6
-
7
-
8
-
9
-
10
-
11
-
12
-
13
-
14
-
15
-
16
-
17
-
18
-
19
-
20
-
21
-
22
-
23
-
24
-
25
-
26
-
27
-
28
-
29
-
30
-
31
-
32
-
33
-
34
-
35
-
36
-
37
-
38
-
39
-
40
-
41
-
42
-
43
-
44
-
45
-
46
-
47
-
48
-
49
-
50
-
51
-
52
-
53
-
54
-
55
-
56
-
57
-
58
-
59
-
60
-
61
-
62
-
63
-
64
-
65
-
66
-
67
-
68
-
69
-
70
-
71
-
72
-
73
-
74
-
75
-
76
-
77
-
78
-
79
-
80
-
81
-
82
-
83
-
84
-
85
-
86
-
87
-
88
-
89
-
90
-
91
-
92
-
93
-
94
-
95
-
96
-
97
-
98
-
99
-
100
-
101
-
102
-
103
-
104
-
105
-
106
-
107
-
108
-
109
-
110
-
111
-
112
-
113
-
 114
114 -
 115
115 -
 116
116 -
 117
117 -
 118
118 -
 119
119 -
 120
120 -
 121
121 -
 122
122 -
 123
123 -
 124
124 -
 125
125 -
 126
126 -
 127
127 -
 128
128 -
 129
129 -
 130
130 -
 131
131 -
 132
132 -
 133
133 -
 134
134 -
135
-
136
-
137
-
138
-
139
-
140
-
141
-
142
-
143
-
144
-
145
-
146
-
147
-
148
-
149
-
150
-
151
-
152
-
153
-
154
-
155
-
156
-
157
-
158
-
159
-
160
-
161
-
162
-
163
-
164
-
165
-
166
-
167
-
168
-
169
-
170
-
171
-
172
-
173
-
174
-
175
-
176
-
177
-
178
-
179
-
180
-
181
-
182
-
183
-
184
-
185
-
186
-
187
-
188
-
189
-
190
-
191
-
192
-
193
-
194
-
195
-
196
-
197
-
198
-
199
-
200
-
201
-
202
-
203
-
204
-
205
-
206
-
207
-
208
-
209
-
210
-
211
-
212
-
213
-
214
-
215
-
216
-
217
-
218
-
219
-
220
-
221
-
222
-
223
-
224
-
225
-
226
-
227
-
228
-
229
-
230
-
231
-
232
-
233
-
234
-
235
-
236
-
237
-
238
-
239
-
240
-
241
-
242
-
243
-
244
-
245
-
246
-
247
-
248
-
249
-
250
-
251
-
252
-
253
-
254
-
255
-
256
-
257
-
258
-
259
-
260
-
261
-
262
-
263
-
264
-
265
-
266
-
267
-
268
-
269
-
270
-
271
-
272
-
273
-
274
-
275
-
276
-
277
-
278
-
279
-
280
-
281
-
282
-
283
-
284
-
285
-
286
-
287
-
288
-
289
-
290
-
291
-
292
-
293
-
294
-
295
-
296
-
297
-
298
-
299
-
300
-
301
-
302
-
303
-
304
-
305
-
306
-
307
-
308
-
309
-
310
-
311
-
312
-
313
-
314
-
315
-
316
-
317
-
318
-
319
-
320
-
321
-
322
-
323
-
324
-
325
-
326
-
327
-
328
-
329
-
330
-
331
-
332
-
333
-
334
-
335
-
336
 |
 |

124 Management’s discussion and analysis
Segment Information Analysis
Operations
Automation and Drives (A&D)
A&D increased its Group profi t 33% compared to fi scal 2006, to €2.090 billion.
A&D’s largest divisions led the increase, including signifi cant earnings growth in
the Industrial Automation Systems, Mechanical Drives, Motion Control Systems
and Large Drives divisions. The Group gained operating leverage on rising vol-
ume, particularly evident in lower selling costs as a percent of revenue. As a
result, A&D’s Group profi t margin rose compared to fi scal 2006, even though the
increase was held back by €143 million in purchase price accounting (PPA) effects
associated with the Group’s acquisitions of UGS Corp. (in May 2007) and Flender
Holding GmbH (in fi scal 2005) as well as €23 million in integration costs. A&D saw
a corresponding increase in amortization for intangible assets year-over-year.
Orders at A&D rose 17% year-over-year, to €16.794 billion, and revenue rose
18%, to €15.389 billion. Both orders and revenue included double-digit increases
in Germany and all major regions of the world. A&D continued to generate the
largest share of its business in Europe (including Germany), which accounted for
60% of revenue from external customers in both fi scal years. Revenue and orders
benefi ted from the acquisition of UGS, a leading provider of product lifecycle
management (PLM) software which A&D acquired to complement and extend
its existing software capabilities. The PLM business got off to a good start within
A&D, launching its technology integration and winning new customers for the
Group.
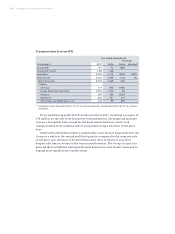
Year ended September 30,
% Change
(€ in millions) 2007 2006 Actual Adjusted*
Group profi t 2,090 1,575 33%
Group profi t margin 13.6% 12.1%
New orders 16,794 14,312 17% 16%
Total revenue 15,389 13,041 18% 16%
External revenue 13,695 11,564 18%
Therein:
Germany 3,991 3,396 18%
Europe (other than Germany) 4,191 3,485 20%
Americas 2,643 2,324 14%
Asia-Pacifi c 2,419 2,017 20%
Africa, Near and Middle East, C.I.S. 451 342 32%
* Excluding currency translation effects of (2)% on revenue and orders, and portfolio effects of 4% and 3% on
revenue and orders, respectively.