Siemens 2007 Annual Report Download - page 312
Download and view the complete annual report
Please find page 312 of the 2007 Siemens annual report below. You can navigate through the pages in the report by either clicking on the pages listed below, or by using the keyword search tool below to find specific information within the annual report.-
 1
1 -
2
-
3
-
4
-
5
-
6
-
7
-
8
-
9
-
10
-
11
-
12
-
13
-
14
-
15
-
16
-
17
-
18
-
19
-
20
-
21
-
22
-
23
-
24
-
25
-
26
-
27
-
28
-
29
-
30
-
31
-
32
-
33
-
34
-
35
-
36
-
37
-
38
-
39
-
40
-
41
-
42
-
43
-
44
-
45
-
46
-
47
-
48
-
49
-
50
-
51
-
52
-
53
-
54
-
55
-
56
-
57
-
58
-
59
-
60
-
61
-
62
-
63
-
64
-
65
-
66
-
67
-
68
-
69
-
70
-
71
-
72
-
73
-
74
-
75
-
76
-
77
-
78
-
79
-
80
-
81
-
82
-
83
-
84
-
85
-
86
-
87
-
88
-
89
-
90
-
91
-
92
-
93
-
94
-
95
-
96
-
97
-
98
-
99
-
100
-
101
-
102
-
103
-
104
-
105
-
106
-
107
-
108
-
109
-
110
-
111
-
112
-
113
-
114
-
115
-
116
-
117
-
118
-
119
-
120
-
121
-
122
-
123
-
124
-
125
-
126
-
127
-
128
-
129
-
130
-
131
-
132
-
133
-
134
-
135
-
136
-
137
-
138
-
139
-
140
-
141
-
142
-
143
-
144
-
145
-
146
-
147
-
148
-
149
-
150
-
151
-
152
-
153
-
154
-
155
-
156
-
157
-
158
-
159
-
160
-
161
-
162
-
163
-
164
-
165
-
166
-
167
-
168
-
169
-
170
-
171
-
172
-
173
-
174
-
175
-
176
-
177
-
178
-
179
-
180
-
181
-
182
-
183
-
184
-
185
-
186
-
187
-
188
-
189
-
190
-
191
-
192
-
193
-
194
-
195
-
196
-
197
-
198
-
199
-
200
-
201
-
202
-
203
-
204
-
205
-
206
-
207
-
208
-
209
-
210
-
211
-
212
-
213
-
214
-
215
-
216
-
217
-
218
-
219
-
220
-
221
-
222
-
223
-
224
-
225
-
226
-
227
-
228
-
229
-
230
-
231
-
232
-
233
-
234
-
235
-
236
-
237
-
238
-
239
-
240
-
241
-
242
-
243
-
244
-
245
-
246
-
247
-
248
-
249
-
250
-
251
-
252
-
253
-
254
-
255
-
256
-
257
-
258
-
259
-
260
-
261
-
262
-
263
-
264
-
265
-
266
-
267
-
268
-
269
-
270
-
271
-
272
-
273
-
274
-
275
-
276
-
277
-
278
-
279
-
280
-
281
-
282
-
283
-
284
-
285
-
286
-
287
-
288
-
289
-
290
-
291
-
292
-
293
-
294
-
295
-
296
-
297
-
298
-
299
-
300
-
301
-
 302
302 -
 303
303 -
 304
304 -
 305
305 -
 306
306 -
 307
307 -
 308
308 -
 309
309 -
 310
310 -
 311
311 -
 312
312 -
 313
313 -
 314
314 -
 315
315 -
 316
316 -
 317
317 -
 318
318 -
 319
319 -
 320
320 -
 321
321 -
 322
322 -
323
-
324
-
325
-
326
-
327
-
328
-
329
-
330
-
331
-
332
-
333
-
334
-
335
-
336
 |
 |

312 Notes to Consolidated Financial Statements
(in millions of €, except where otherwise stated and per share amounts)
Financing and Real Estate
The Company’s performance measurement for its Financing and Real Estate
Groups is Income before income taxes. In contrast to the performance measure-
ment used for the Operations Groups, interest income and expense is an impor-
tant source of revenue and expense for Financing and Real Estate.
For the years ended September 30, 2007 and 2006, Income before income taxes
at SFS includes interest revenue of €553 and €557, respectively, and interest
expense of €359 and €331, respectively. In addition, Income before income taxes
includes earnings from equity investees for the years ended September 30, 2007
and 2006 of €59 and €57, respectively.
For the years ended September 30, 2007 and 2006, Income before income taxes
at SRE includes interest revenue of €31 and €49, respectively, and interest expense
of €117 and €138, respectively.
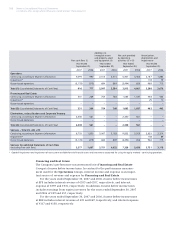
Free cash fl ow (I)
Additions to
intangible assets
and property, plant
and equipment (II)
Net cash provided
by operating
activities (I) + (II)
Amortization,
depreciation and
impairments
Year ended
September 30,
Year ended
September 30,
Year ended
September 30,
Year ended
September 30,
2007 2006 2007 2006 2007 2006 2007 2006
Operations
Continuing, according to Segment information 4,094 990 2,313 2,415 6,407 3,405 2,187 1,882
Impairment* 133 79
Discontinued operations (3,178) (213) 684 869 (2,494) 656 968 715
Total (1) (Consolidated Statements of Cash Flow) 916 777 2,997 3,284 3,913 4,061 3,288 2,676
Financing and Real Estate
Continuing, according to Segment information 331 269 754 768 1,085 1,037 438 432
Impairment* 25 10
Discontinued operations – – – – – – – –
Total (2) (Consolidated Statements of Cash Flow) 331 269 754 768 1,085 1,037 463 442
Eliminations, reclassifi cations and Corporate Treasury
Continuing, according to Segment information 2,330 561 – – 2,330 561 – –
Discontinued operations – – – – – – – –
Total (3) (Consolidated Statements of Cash Flow) 2,330 561 – – 2,330 561 – –
Siemens – Total (1) + (2) + (3)
Continuing, according to Segment information 6,755 1,820 3,067 3,183 9,822 5,003 2,625 2,314
Impairment* 158 89
Discontinued operations (3,178) (213) 684 869 (2,494) 656 968 715
Siemens Consolidated Statements of Cash Flow
(excluding Free cash fl ow) 3,577 1,607 3,751 4,052 7,328 5,659 3,751 3,118
* Goodwill impairment and impairment of non-current available-for-sale fi nancial assets and investments accounted for using the equity method – continuing operations.