Siemens 2007 Annual Report Download - page 204
Download and view the complete annual report
Please find page 204 of the 2007 Siemens annual report below. You can navigate through the pages in the report by either clicking on the pages listed below, or by using the keyword search tool below to find specific information within the annual report.-
 1
1 -
2
-
3
-
4
-
5
-
6
-
7
-
8
-
9
-
10
-
11
-
12
-
13
-
14
-
15
-
16
-
17
-
18
-
19
-
20
-
21
-
22
-
23
-
24
-
25
-
26
-
27
-
28
-
29
-
30
-
31
-
32
-
33
-
34
-
35
-
36
-
37
-
38
-
39
-
40
-
41
-
42
-
43
-
44
-
45
-
46
-
47
-
48
-
49
-
50
-
51
-
52
-
53
-
54
-
55
-
56
-
57
-
58
-
59
-
60
-
61
-
62
-
63
-
64
-
65
-
66
-
67
-
68
-
69
-
70
-
71
-
72
-
73
-
74
-
75
-
76
-
77
-
78
-
79
-
80
-
81
-
82
-
83
-
84
-
85
-
86
-
87
-
88
-
89
-
90
-
91
-
92
-
93
-
94
-
95
-
96
-
97
-
98
-
99
-
100
-
101
-
102
-
103
-
104
-
105
-
106
-
107
-
108
-
109
-
110
-
111
-
112
-
113
-
114
-
115
-
116
-
117
-
118
-
119
-
120
-
121
-
122
-
123
-
124
-
125
-
126
-
127
-
128
-
129
-
130
-
131
-
132
-
133
-
134
-
135
-
136
-
137
-
138
-
139
-
140
-
141
-
142
-
143
-
144
-
145
-
146
-
147
-
148
-
149
-
150
-
151
-
152
-
153
-
154
-
155
-
156
-
157
-
158
-
159
-
160
-
161
-
162
-
163
-
164
-
165
-
166
-
167
-
168
-
169
-
170
-
171
-
172
-
173
-
174
-
175
-
176
-
177
-
178
-
179
-
180
-
181
-
182
-
183
-
184
-
185
-
186
-
187
-
188
-
189
-
190
-
191
-
192
-
193
-
 194
194 -
 195
195 -
 196
196 -
 197
197 -
 198
198 -
 199
199 -
 200
200 -
 201
201 -
 202
202 -
 203
203 -
 204
204 -
 205
205 -
 206
206 -
 207
207 -
 208
208 -
 209
209 -
 210
210 -
 211
211 -
 212
212 -
 213
213 -
 214
214 -
215
-
216
-
217
-
218
-
219
-
220
-
221
-
222
-
223
-
224
-
225
-
226
-
227
-
228
-
229
-
230
-
231
-
232
-
233
-
234
-
235
-
236
-
237
-
238
-
239
-
240
-
241
-
242
-
243
-
244
-
245
-
246
-
247
-
248
-
249
-
250
-
251
-
252
-
253
-
254
-
255
-
256
-
257
-
258
-
259
-
260
-
261
-
262
-
263
-
264
-
265
-
266
-
267
-
268
-
269
-
270
-
271
-
272
-
273
-
274
-
275
-
276
-
277
-
278
-
279
-
280
-
281
-
282
-
283
-
284
-
285
-
286
-
287
-
288
-
289
-
290
-
291
-
292
-
293
-
294
-
295
-
296
-
297
-
298
-
299
-
300
-
301
-
302
-
303
-
304
-
305
-
306
-
307
-
308
-
309
-
310
-
311
-
312
-
313
-
314
-
315
-
316
-
317
-
318
-
319
-
320
-
321
-
322
-
323
-
324
-
325
-
326
-
327
-
328
-
329
-
330
-
331
-
332
-
333
-
334
-
335
-
336
 |
 |

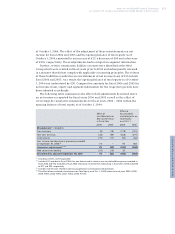
204 Consolidated Financial Statements
Consolidated Statements of Cash Flow
For the fi scal years ended September 30, 2007 and 2006 (in millions of €)
Siemens
2007 2006
Cash fl ows from operating activities
Net income (loss) 4,038 3,345
Adjustments to reconcile net income to cash provided
Amortization, depreciation and impairments 3,751 3,118
Income taxes 2,193 775
Interest (income) expense, net 193 (142)
(Gains) losses on sales and disposals of businesses, intangibles and property, plant and equipment, net (2,051) (113)
(Gains) on sales of investments, net(1) (95) (104)
(Gains) losses on sales and impairments of current available-for-sale fi nancial assets, net 32 (466)
(Income) from investments(1) (223) (569)
Other non-cash (income) expenses 106 372
Change in current assets and liabilities
(Increase) decrease in inventories (986) (2,313)
(Increase) decrease in trade and other receivables (1,183) (1,027)
(Increase) decrease in other current assets (486) 572
Increase (decrease) in trade payables 1,158 279
Increase (decrease) in current provisions (258) (34)
Increase (decrease) in other current liabilities 2,858 2,053
Change in other assets and liabilities (883) 41
Income taxes paid (1,930) (1,191)
Dividends received 337 378
Interest received 757 685
Net cash provided by operating activities – continuing and discontinued operations 7,328 5,659
Net cash provided by operating activities – continuing operations 9,822 5,003
Cash fl ows from investing activities
Additions to intangible assets and property, plant and equipment (3,751) (4,052)
Acquisitions, net of cash acquired (7,370) (2,055)
Purchases of investments(1) (261) (389)
Purchases of current available-for-sale fi nancial assets (148) (1,489)
(Increase) decrease in receivables from fi nancing activities (907) (469)
Proceeds from sales of investments, intangibles and property, plant and equipment(1) 1,041 914
Proceeds from disposals of businesses (380) (260)
Proceeds from sales of current available-for-sale fi nancial assets 419 3,104
Net cash provided by (used in) investing activities – continuing and discontinued operations (11,357) (4,696)
Net cash provided by (used in) investing activities – continuing operations (10,068) (4,315)
Cash fl ows from fi nancing activities
Proceeds from issuance of common stock 903 –
Purchase of common stock (101) (421)
Proceeds from re-issuance of treasury stock 66 313
Proceeds from issuance of long-term debt 766 6,701
Repayment of long-term debt (including current maturities of long-term debt) (4,595) (1,710)
Change in short-term debt 4,386 (1,762)
Interest paid (1,169) (596)
Dividends paid (1,292) (1,201)
Dividends paid to minority shareholders (151) (118)
Intragroup fi nancing – –
Net cash provided by operating activities – continuing and discontinued operations (1,187) 1,206
Net cash provided by (used in) fi nancing activities – continuing operations (5,792) 1,540
Effect of exchange rates on cash and cash equivalents (58) (76)
Net increase (decrease) in cash and cash equivalents (5,274) 2,093
Cash and cash equivalents at beginning of period 10,214 8,121
Cash and cash equivalents at end of period 4,940 10,214
Less: Cash and cash equivalents of discontinued operations at end of period 935 –
Cash and cash equivalents of continuing operations at end of period 4,005 10,214
(1) Investments include equity instruments either classifi ed as non-current available-for-sale fi nancial assets or accounted for using the equity method.
The accompanying Notes are an integral part of these Consolidated Financial Statements.