Siemens 2007 Annual Report Download - page 127
Download and view the complete annual report
Please find page 127 of the 2007 Siemens annual report below. You can navigate through the pages in the report by either clicking on the pages listed below, or by using the keyword search tool below to find specific information within the annual report.-
 1
1 -
2
-
3
-
4
-
5
-
6
-
7
-
8
-
9
-
10
-
11
-
12
-
13
-
14
-
15
-
16
-
17
-
18
-
19
-
20
-
21
-
22
-
23
-
24
-
25
-
26
-
27
-
28
-
29
-
30
-
31
-
32
-
33
-
34
-
35
-
36
-
37
-
38
-
39
-
40
-
41
-
42
-
43
-
44
-
45
-
46
-
47
-
48
-
49
-
50
-
51
-
52
-
53
-
54
-
55
-
56
-
57
-
58
-
59
-
60
-
61
-
62
-
63
-
64
-
65
-
66
-
67
-
68
-
69
-
70
-
71
-
72
-
73
-
74
-
75
-
76
-
77
-
78
-
79
-
80
-
81
-
82
-
83
-
84
-
85
-
86
-
87
-
88
-
89
-
90
-
91
-
92
-
93
-
94
-
95
-
96
-
97
-
98
-
99
-
100
-
101
-
102
-
103
-
104
-
105
-
106
-
107
-
108
-
109
-
110
-
111
-
112
-
113
-
114
-
115
-
116
-
 117
117 -
 118
118 -
 119
119 -
 120
120 -
 121
121 -
 122
122 -
 123
123 -
 124
124 -
 125
125 -
 126
126 -
 127
127 -
 128
128 -
 129
129 -
 130
130 -
 131
131 -
 132
132 -
 133
133 -
 134
134 -
 135
135 -
 136
136 -
 137
137 -
138
-
139
-
140
-
141
-
142
-
143
-
144
-
145
-
146
-
147
-
148
-
149
-
150
-
151
-
152
-
153
-
154
-
155
-
156
-
157
-
158
-
159
-
160
-
161
-
162
-
163
-
164
-
165
-
166
-
167
-
168
-
169
-
170
-
171
-
172
-
173
-
174
-
175
-
176
-
177
-
178
-
179
-
180
-
181
-
182
-
183
-
184
-
185
-
186
-
187
-
188
-
189
-
190
-
191
-
192
-
193
-
194
-
195
-
196
-
197
-
198
-
199
-
200
-
201
-
202
-
203
-
204
-
205
-
206
-
207
-
208
-
209
-
210
-
211
-
212
-
213
-
214
-
215
-
216
-
217
-
218
-
219
-
220
-
221
-
222
-
223
-
224
-
225
-
226
-
227
-
228
-
229
-
230
-
231
-
232
-
233
-
234
-
235
-
236
-
237
-
238
-
239
-
240
-
241
-
242
-
243
-
244
-
245
-
246
-
247
-
248
-
249
-
250
-
251
-
252
-
253
-
254
-
255
-
256
-
257
-
258
-
259
-
260
-
261
-
262
-
263
-
264
-
265
-
266
-
267
-
268
-
269
-
270
-
271
-
272
-
273
-
274
-
275
-
276
-
277
-
278
-
279
-
280
-
281
-
282
-
283
-
284
-
285
-
286
-
287
-
288
-
289
-
290
-
291
-
292
-
293
-
294
-
295
-
296
-
297
-
298
-
299
-
300
-
301
-
302
-
303
-
304
-
305
-
306
-
307
-
308
-
309
-
310
-
311
-
312
-
313
-
314
-
315
-
316
-
317
-
318
-
319
-
320
-
321
-
322
-
323
-
324
-
325
-
326
-
327
-
328
-
329
-
330
-
331
-
332
-
333
-
334
-
335
-
336
 |
 |

Management’s discussion and analysis 127
Management’s discussion and analysis
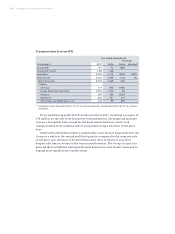
Osram
Osram’s Group profi t of €492 million in fi scal 2007 was 8% higher than in the
prior year. Along with strength in its large general lighting business, Osram bene-
fi ted from higher earnings in its optical semiconductors business. Broad-based
demand throughout the Group took revenue and orders up to €4.690 billion for
the fi scal year. Excluding adverse currency translation effects, primarily in
Osram’s large U.S. market, revenue and orders rose 7% compared to the prior year
on rising demand in Europe and Asia-Pacifi c.
The trend towards energy-effi cient lighting solutions had a positive impact on
the performance for the 2007 fi scal year. Osram was successful in innovative com-
pact fl uorescent lamps, high-intensity discharge lamps and LEDs. Energy-effi cient
products already account for 60 percent of revenue, and Osram intends to increase
this to 80 percent over the next ten years. Osram’s main focus for research and
development is to make further advances in optical semiconductors (LED and
OLED) and energy effi ciency, for example with energy-saving lamps and with
high-intensity discharge lamps.
Year ended September 30,
% Change
(€ in millions) 2007 2006 Actual Adjusted*
Group profi t 492 456 8%
Group profi t margin 10.5% 10.0%
New orders 4,690 4,563 3% 7%
Total revenue 4,690 4,563 3% 7%
External revenue 4,677 4,547 3%
Therein:
Germany 539 535 1%
Europe (other than Germany) 1,216 1,126 8%
Americas 1,947 1,982 (2)%
Asia-Pacifi c 780 736 6%
Africa, Near and Middle East, C.I.S. 195 168 16%
* Excluding currency translation effects of (4)% on revenue and orders.