Siemens 2007 Annual Report Download - page 257
Download and view the complete annual report
Please find page 257 of the 2007 Siemens annual report below. You can navigate through the pages in the report by either clicking on the pages listed below, or by using the keyword search tool below to find specific information within the annual report.-
 1
1 -
2
-
3
-
4
-
5
-
6
-
7
-
8
-
9
-
10
-
11
-
12
-
13
-
14
-
15
-
16
-
17
-
18
-
19
-
20
-
21
-
22
-
23
-
24
-
25
-
26
-
27
-
28
-
29
-
30
-
31
-
32
-
33
-
34
-
35
-
36
-
37
-
38
-
39
-
40
-
41
-
42
-
43
-
44
-
45
-
46
-
47
-
48
-
49
-
50
-
51
-
52
-
53
-
54
-
55
-
56
-
57
-
58
-
59
-
60
-
61
-
62
-
63
-
64
-
65
-
66
-
67
-
68
-
69
-
70
-
71
-
72
-
73
-
74
-
75
-
76
-
77
-
78
-
79
-
80
-
81
-
82
-
83
-
84
-
85
-
86
-
87
-
88
-
89
-
90
-
91
-
92
-
93
-
94
-
95
-
96
-
97
-
98
-
99
-
100
-
101
-
102
-
103
-
104
-
105
-
106
-
107
-
108
-
109
-
110
-
111
-
112
-
113
-
114
-
115
-
116
-
117
-
118
-
119
-
120
-
121
-
122
-
123
-
124
-
125
-
126
-
127
-
128
-
129
-
130
-
131
-
132
-
133
-
134
-
135
-
136
-
137
-
138
-
139
-
140
-
141
-
142
-
143
-
144
-
145
-
146
-
147
-
148
-
149
-
150
-
151
-
152
-
153
-
154
-
155
-
156
-
157
-
158
-
159
-
160
-
161
-
162
-
163
-
164
-
165
-
166
-
167
-
168
-
169
-
170
-
171
-
172
-
173
-
174
-
175
-
176
-
177
-
178
-
179
-
180
-
181
-
182
-
183
-
184
-
185
-
186
-
187
-
188
-
189
-
190
-
191
-
192
-
193
-
194
-
195
-
196
-
197
-
198
-
199
-
200
-
201
-
202
-
203
-
204
-
205
-
206
-
207
-
208
-
209
-
210
-
211
-
212
-
213
-
214
-
215
-
216
-
217
-
218
-
219
-
220
-
221
-
222
-
223
-
224
-
225
-
226
-
227
-
228
-
229
-
230
-
231
-
232
-
233
-
234
-
235
-
236
-
237
-
238
-
239
-
240
-
241
-
242
-
243
-
244
-
245
-
246
-
 247
247 -
 248
248 -
 249
249 -
 250
250 -
 251
251 -
 252
252 -
 253
253 -
 254
254 -
 255
255 -
 256
256 -
 257
257 -
 258
258 -
 259
259 -
 260
260 -
 261
261 -
 262
262 -
 263
263 -
 264
264 -
 265
265 -
 266
266 -
 267
267 -
268
-
269
-
270
-
271
-
272
-
273
-
274
-
275
-
276
-
277
-
278
-
279
-
280
-
281
-
282
-
283
-
284
-
285
-
286
-
287
-
288
-
289
-
290
-
291
-
292
-
293
-
294
-
295
-
296
-
297
-
298
-
299
-
300
-
301
-
302
-
303
-
304
-
305
-
306
-
307
-
308
-
309
-
310
-
311
-
312
-
313
-
314
-
315
-
316
-
317
-
318
-
319
-
320
-
321
-
322
-
323
-
324
-
325
-
326
-
327
-
328
-
329
-
330
-
331
-
332
-
333
-
334
-
335
-
336
 |
 |

Notes to Consolidated Financial Statements 257
(in millions of €, except where otherwise stated and per share amounts)
Notes to Consolidated Financial Statements
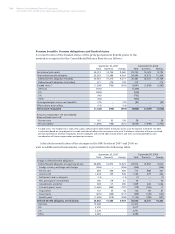
The total defi ned benefi t obligation at the end of the fi scal year includes
approximately €9,072 for active employees, €2,945 for former employees with
vested benefi ts and €13,035 for retirees and surviving dependents.
In fi scal 2007, as well as in fi scal 2006, the DBO decreased due to an increase
in discount rate for the domestic and foreign pension plans. For the domestic
pension plans in fi scal 2007, a negative effect on DBO of an increase in pension
progression rate was largely offset by a positive effect of increased assumed
retirement ages.
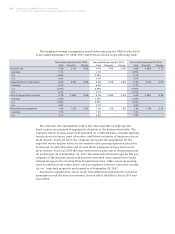
The following table shows the change in plan assets for fi scal year 2007 and
2006 and some additional information concerning pension plans:
In fi scal 2007, the DBO and the fair value of plan assets decreased due to the
contribution of the carrier-related operations of Siemens to NSN. These effects are
included in the items Divestments and Divestments and other in the preceding two
tables. In fi scal 2006, the Company merged a defi ned contribution plan with a
defi ned benefi t plan at a subsidiary in Switzerland. As a result of the merger, the
benefi ts of the defi ned contribution plan were harmonized with those of the
defi ned benefi t plan. Accordingly, the DBO and plan assets of the newly merged
plan increased. Such amounts are included in the items Amendments and other
and Acquisitions and other in the preceding two tables. Vested past service cost
resulting from that merger has been recognized entirely in NPBC for fi scal 2006.
September 30, 2007 September 30, 2006
Total Domestic Foreign Total Domestic Foreign
Change in plan assets:
Fair value of plan assets at beginning of year 23,755 15,023 8,732 21,581 14,349 7,232
Foreign currency exchange rate changes (508) – (508) (170) – (170)
Expected return on plan assets 1,513 947 566 1,433 953 480
Actuarial gains (losses) on plan assets (218) (369) 151 (67) (212) 145
Acquisitions and other 293 – 293 1,561 440 1,121
Divestments and other (610) (417) (193) (237) (39) (198)
Employer contributions (regular) 837 271 566 730 320 410
Plan participants’ contributions 177 116 61 49 – 49
Benefi ts paid (1,226) (818) (408) (1,125) (788) (337)
Fair value of plan assets at end of year 24,013 14,753 9,260 23,755 15,023 8,732
Germany 14,753 15,023
U.S. 3,048 3,118
U.K. 3,189 2,818
Other 3,023 2,796