Siemens 2007 Annual Report Download - page 120
Download and view the complete annual report
Please find page 120 of the 2007 Siemens annual report below. You can navigate through the pages in the report by either clicking on the pages listed below, or by using the keyword search tool below to find specific information within the annual report.-
 1
1 -
2
-
3
-
4
-
5
-
6
-
7
-
8
-
9
-
10
-
11
-
12
-
13
-
14
-
15
-
16
-
17
-
18
-
19
-
20
-
21
-
22
-
23
-
24
-
25
-
26
-
27
-
28
-
29
-
30
-
31
-
32
-
33
-
34
-
35
-
36
-
37
-
38
-
39
-
40
-
41
-
42
-
43
-
44
-
45
-
46
-
47
-
48
-
49
-
50
-
51
-
52
-
53
-
54
-
55
-
56
-
57
-
58
-
59
-
60
-
61
-
62
-
63
-
64
-
65
-
66
-
67
-
68
-
69
-
70
-
71
-
72
-
73
-
74
-
75
-
76
-
77
-
78
-
79
-
80
-
81
-
82
-
83
-
84
-
85
-
86
-
87
-
88
-
89
-
90
-
91
-
92
-
93
-
94
-
95
-
96
-
97
-
98
-
99
-
100
-
101
-
102
-
103
-
104
-
105
-
106
-
107
-
108
-
109
-
 110
110 -
 111
111 -
 112
112 -
 113
113 -
 114
114 -
 115
115 -
 116
116 -
 117
117 -
 118
118 -
 119
119 -
 120
120 -
 121
121 -
 122
122 -
 123
123 -
 124
124 -
 125
125 -
 126
126 -
 127
127 -
 128
128 -
 129
129 -
 130
130 -
131
-
132
-
133
-
134
-
135
-
136
-
137
-
138
-
139
-
140
-
141
-
142
-
143
-
144
-
145
-
146
-
147
-
148
-
149
-
150
-
151
-
152
-
153
-
154
-
155
-
156
-
157
-
158
-
159
-
160
-
161
-
162
-
163
-
164
-
165
-
166
-
167
-
168
-
169
-
170
-
171
-
172
-
173
-
174
-
175
-
176
-
177
-
178
-
179
-
180
-
181
-
182
-
183
-
184
-
185
-
186
-
187
-
188
-
189
-
190
-
191
-
192
-
193
-
194
-
195
-
196
-
197
-
198
-
199
-
200
-
201
-
202
-
203
-
204
-
205
-
206
-
207
-
208
-
209
-
210
-
211
-
212
-
213
-
214
-
215
-
216
-
217
-
218
-
219
-
220
-
221
-
222
-
223
-
224
-
225
-
226
-
227
-
228
-
229
-
230
-
231
-
232
-
233
-
234
-
235
-
236
-
237
-
238
-
239
-
240
-
241
-
242
-
243
-
244
-
245
-
246
-
247
-
248
-
249
-
250
-
251
-
252
-
253
-
254
-
255
-
256
-
257
-
258
-
259
-
260
-
261
-
262
-
263
-
264
-
265
-
266
-
267
-
268
-
269
-
270
-
271
-
272
-
273
-
274
-
275
-
276
-
277
-
278
-
279
-
280
-
281
-
282
-
283
-
284
-
285
-
286
-
287
-
288
-
289
-
290
-
291
-
292
-
293
-
294
-
295
-
296
-
297
-
298
-
299
-
300
-
301
-
302
-
303
-
304
-
305
-
306
-
307
-
308
-
309
-
310
-
311
-
312
-
313
-
314
-
315
-
316
-
317
-
318
-
319
-
320
-
321
-
322
-
323
-
324
-
325
-
326
-
327
-
328
-
329
-
330
-
331
-
332
-
333
-
334
-
335
-
336
 |
 |

120 Management’s discussion and analysis
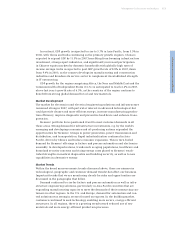
Revenue for fi scal 2007 totaled €72.448 billion, a 9% increase compared to fi s-
cal 2006. Revenue in Europe outside Germany rose 11% year-over-year, to €22.801
billion, with A&D, PG and Med leading the increase. Revenue growth was more
restrained in the Americas, affected by the considerable weakening of the U.S.
dollar against the euro during the year, coming in 5% higher than in fi scal 2006
at €19.321 billion. Energy, automation and medical solutions were the highlights
for the Americas overall as well as for the U.S., which accounted for 77% of the
region’s revenue for the year. On an organic basis, revenue for the Americas and
the U.S. climbed 9% and 7% year-over-year, respectively.
Revenue grew more rapidly in Asia-Pacifi c, reaching €10.937 billion on a 16%
rise. Revenue in China was up 13% to €4.146 billion, as A&D, PG and TS converted
major orders from prior periods into current business. While the majority of
Groups booked more revenue in China than in India, revenue for India jumped
62% year-over-year from €1.034 billion to €1.676 billion and every operating
Group posted double-digit increases. Together China and India accounted for 53%
of Asia-Pacifi c revenue, up from 50% in fi scal 2006. The Africa, Near and Middle
East, C.I.S. region saw 17% growth compared to the prior year, benefi ting from
large infrastructure orders in prior years. Most Groups posted double-digit
increases in the region, with Siemens’ energy businesses accounting for 63% of
the total volume of €6.795 billion.
Revenue (location of customer)
Year ended
September 30,
% Change
vs. previous year therein
(€ in millions) 2007 2006 Actual Adjusted* Currency Portfolio
Germany 12,594 12,382 2% 2% 0% 0%
Europe (other than Germany) 22,801 20,489 11% 10% 0% 1%
Americas 19,321 18,371 5% 9% (8)% 4%
Asia-Pacifi c 10,937 9,457 16% 18% (3)% 1%
Africa, Near and
Middle East, C.I.S.** 6,795 5,788 17% 19% (3)% 1%
Siemens 72,448 66,487 9% 10% (3)% 2%
* Excluding currency translation and portfolio effects.
** Commonwealth of Independent States.
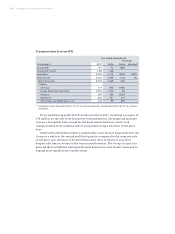
Year ended
September 30,
(€ in millions) 2007 2006 % Change
Gross profi t on revenue 20,876 17,379 20%
as percentage of revenue 28.8% 26.1%