Siemens 2007 Annual Report Download - page 214
Download and view the complete annual report
Please find page 214 of the 2007 Siemens annual report below. You can navigate through the pages in the report by either clicking on the pages listed below, or by using the keyword search tool below to find specific information within the annual report.-
 1
1 -
2
-
3
-
4
-
5
-
6
-
7
-
8
-
9
-
10
-
11
-
12
-
13
-
14
-
15
-
16
-
17
-
18
-
19
-
20
-
21
-
22
-
23
-
24
-
25
-
26
-
27
-
28
-
29
-
30
-
31
-
32
-
33
-
34
-
35
-
36
-
37
-
38
-
39
-
40
-
41
-
42
-
43
-
44
-
45
-
46
-
47
-
48
-
49
-
50
-
51
-
52
-
53
-
54
-
55
-
56
-
57
-
58
-
59
-
60
-
61
-
62
-
63
-
64
-
65
-
66
-
67
-
68
-
69
-
70
-
71
-
72
-
73
-
74
-
75
-
76
-
77
-
78
-
79
-
80
-
81
-
82
-
83
-
84
-
85
-
86
-
87
-
88
-
89
-
90
-
91
-
92
-
93
-
94
-
95
-
96
-
97
-
98
-
99
-
100
-
101
-
102
-
103
-
104
-
105
-
106
-
107
-
108
-
109
-
110
-
111
-
112
-
113
-
114
-
115
-
116
-
117
-
118
-
119
-
120
-
121
-
122
-
123
-
124
-
125
-
126
-
127
-
128
-
129
-
130
-
131
-
132
-
133
-
134
-
135
-
136
-
137
-
138
-
139
-
140
-
141
-
142
-
143
-
144
-
145
-
146
-
147
-
148
-
149
-
150
-
151
-
152
-
153
-
154
-
155
-
156
-
157
-
158
-
159
-
160
-
161
-
162
-
163
-
164
-
165
-
166
-
167
-
168
-
169
-
170
-
171
-
172
-
173
-
174
-
175
-
176
-
177
-
178
-
179
-
180
-
181
-
182
-
183
-
184
-
185
-
186
-
187
-
188
-
189
-
190
-
191
-
192
-
193
-
194
-
195
-
196
-
197
-
198
-
199
-
200
-
201
-
202
-
203
-
 204
204 -
 205
205 -
 206
206 -
 207
207 -
 208
208 -
 209
209 -
 210
210 -
 211
211 -
 212
212 -
 213
213 -
 214
214 -
 215
215 -
 216
216 -
 217
217 -
 218
218 -
 219
219 -
 220
220 -
 221
221 -
 222
222 -
 223
223 -
 224
224 -
225
-
226
-
227
-
228
-
229
-
230
-
231
-
232
-
233
-
234
-
235
-
236
-
237
-
238
-
239
-
240
-
241
-
242
-
243
-
244
-
245
-
246
-
247
-
248
-
249
-
250
-
251
-
252
-
253
-
254
-
255
-
256
-
257
-
258
-
259
-
260
-
261
-
262
-
263
-
264
-
265
-
266
-
267
-
268
-
269
-
270
-
271
-
272
-
273
-
274
-
275
-
276
-
277
-
278
-
279
-
280
-
281
-
282
-
283
-
284
-
285
-
286
-
287
-
288
-
289
-
290
-
291
-
292
-
293
-
294
-
295
-
296
-
297
-
298
-
299
-
300
-
301
-
302
-
303
-
304
-
305
-
306
-
307
-
308
-
309
-
310
-
311
-
312
-
313
-
314
-
315
-
316
-
317
-
318
-
319
-
320
-
321
-
322
-
323
-
324
-
325
-
326
-
327
-
328
-
329
-
330
-
331
-
332
-
333
-
334
-
335
-
336
 |
 |

214 Notes to Consolidated Financial Statements
(in millions of €, except where otherwise stated and per share amounts)
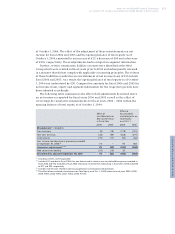
The following table summarizes the effect the corrections had on the affected
line-items on the face of the Consolidated Statements of Income and Consolidated
Balance Sheets for fi scal years 2006 and 2005:
Basis of consolidation – The Consolidated Financial Statements include the
accounts of Siemens AG and its subsidiaries which are directly or indirectly con-
trolled. Control is generally conveyed by ownership of the majority of voting
rights. Additionally, the Company consolidates special purpose entities (SPE’s)
when, based on the evaluation of the substance of the relationship with Siemens,
the Company concludes that it controls the SPE. Associated companies are
recorded in the Consolidated Financial Statements using the equity method of
accounting. Companies in which Siemens has joint control are also recorded using
the equity method.
Fiscal 2006 Fiscal 2005
prior to ad-
justment(1) adjustment adjusted
prior to ad-
justment(1) adjustment adjusted
Misstated Income Statement line-items
Cost of goods sold and services rendered (49,084) (24) (49,108) (40,073) (25) (40,098)
Gross profi t 17,403 (24) 17,379 15,708 (25) 15,683
Income (loss) from continuing operations
before income taxes 3,442 (24) 3,418 3,619 (25) 3,594
Income taxes (742) (34) (776) (735) (46) (781)
Income (loss) from continuing operations 2,700 (58) 2,642 2,884 (71) 2,813
Income (loss) from discontinued operations,
net of income taxes(2) 635 68 703 (224) (13) (237)
Net income (loss) 3,335 10 3,345 2,660 (84) 2,576
Basic earnings per share
Income (loss) from continuing operations 2.85 (0.07) 2.78 3.04 (0.08) 2.96
Income (loss) from discontinued operations 0.66 0.08 0.74 (0.23) (0.02) (0.25)
Net income (loss) 3.51 0.01 3.52 2.81 (0.10) 2.71
Diluted earnings per share
Income (loss) from continuing operations 2.84 (0.07) 2.77 2.93 (0.08) 2.85
Income (loss) from discontinued operations 0.66 0.08 0.74 (0.22) (0.01) (0.23)
Net income (loss) 3.50 0.01 3.51 2.71 (0.09) 2.62
Misstated Balance Sheet line-items
Deferred tax assets 3,860 (203) 3,657 3,493 (233) 3,260
Trade payables 8,443 – 8,443 10,168 (24) 10,144
Income tax payables 1,487 95 1,582 1,499 105 1,604
Deferred tax liabilities 102 82 184 213 76 289
Total equity 26,275 (380) 25,895 24,181 (390) 23,791
(1) The fi gures reported for fi scal 2006 and 2005 as “prior to adjustment” correspond to the fi gures as originally reported after reclassifying SV
that is reported as discontinued operations in 2007. Accordingly, prior periods have been reclassifi ed for comparative purposes.
(2) These adjustments are related to the former Com Group.