Siemens 2007 Annual Report Download - page 311
Download and view the complete annual report
Please find page 311 of the 2007 Siemens annual report below. You can navigate through the pages in the report by either clicking on the pages listed below, or by using the keyword search tool below to find specific information within the annual report.-
 1
1 -
2
-
3
-
4
-
5
-
6
-
7
-
8
-
9
-
10
-
11
-
12
-
13
-
14
-
15
-
16
-
17
-
18
-
19
-
20
-
21
-
22
-
23
-
24
-
25
-
26
-
27
-
28
-
29
-
30
-
31
-
32
-
33
-
34
-
35
-
36
-
37
-
38
-
39
-
40
-
41
-
42
-
43
-
44
-
45
-
46
-
47
-
48
-
49
-
50
-
51
-
52
-
53
-
54
-
55
-
56
-
57
-
58
-
59
-
60
-
61
-
62
-
63
-
64
-
65
-
66
-
67
-
68
-
69
-
70
-
71
-
72
-
73
-
74
-
75
-
76
-
77
-
78
-
79
-
80
-
81
-
82
-
83
-
84
-
85
-
86
-
87
-
88
-
89
-
90
-
91
-
92
-
93
-
94
-
95
-
96
-
97
-
98
-
99
-
100
-
101
-
102
-
103
-
104
-
105
-
106
-
107
-
108
-
109
-
110
-
111
-
112
-
113
-
114
-
115
-
116
-
117
-
118
-
119
-
120
-
121
-
122
-
123
-
124
-
125
-
126
-
127
-
128
-
129
-
130
-
131
-
132
-
133
-
134
-
135
-
136
-
137
-
138
-
139
-
140
-
141
-
142
-
143
-
144
-
145
-
146
-
147
-
148
-
149
-
150
-
151
-
152
-
153
-
154
-
155
-
156
-
157
-
158
-
159
-
160
-
161
-
162
-
163
-
164
-
165
-
166
-
167
-
168
-
169
-
170
-
171
-
172
-
173
-
174
-
175
-
176
-
177
-
178
-
179
-
180
-
181
-
182
-
183
-
184
-
185
-
186
-
187
-
188
-
189
-
190
-
191
-
192
-
193
-
194
-
195
-
196
-
197
-
198
-
199
-
200
-
201
-
202
-
203
-
204
-
205
-
206
-
207
-
208
-
209
-
210
-
211
-
212
-
213
-
214
-
215
-
216
-
217
-
218
-
219
-
220
-
221
-
222
-
223
-
224
-
225
-
226
-
227
-
228
-
229
-
230
-
231
-
232
-
233
-
234
-
235
-
236
-
237
-
238
-
239
-
240
-
241
-
242
-
243
-
244
-
245
-
246
-
247
-
248
-
249
-
250
-
251
-
252
-
253
-
254
-
255
-
256
-
257
-
258
-
259
-
260
-
261
-
262
-
263
-
264
-
265
-
266
-
267
-
268
-
269
-
270
-
271
-
272
-
273
-
274
-
275
-
276
-
277
-
278
-
279
-
280
-
281
-
282
-
283
-
284
-
285
-
286
-
287
-
288
-
289
-
290
-
291
-
292
-
293
-
294
-
295
-
296
-
297
-
298
-
299
-
300
-
 301
301 -
 302
302 -
 303
303 -
 304
304 -
 305
305 -
 306
306 -
 307
307 -
 308
308 -
 309
309 -
 310
310 -
 311
311 -
 312
312 -
 313
313 -
 314
314 -
 315
315 -
 316
316 -
 317
317 -
 318
318 -
 319
319 -
 320
320 -
 321
321 -
322
-
323
-
324
-
325
-
326
-
327
-
328
-
329
-
330
-
331
-
332
-
333
-
334
-
335
-
336
 |
 |

Notes to Consolidated Financial Statements 311
(in millions of €, except where otherwise stated and per share amounts)
Notes to Consolidated Financial Statements
The following table reconciles total assets of the Operations component to net
capital employed of the Operations Groups as disclosed in Segment Information
according to the above defi nition:
Beginning in the third quarter of fi scal 2007, Segment Information discloses
Free cash fl ow and Additions to property, plant and equipment and intangibles.
These replace Net cash from operating and investing activities and Capital spend-
ing, which were reported until March 31, 2007. Free cash fl ow represents net cash
provided by (used in) operating activities less additions to intangible assets and
property, plant and equipment. At the same time, beginning in the third quarter
of fi scal 2007, Amortization, depreciation and impairments presented in Segment
information includes amortization and impairments of intangible assets other than
goodwill and depreciation and impairments of property, plant and equipment.
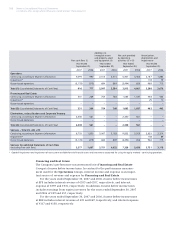
The following table reconciles Free cash fl ow of the Operations, Financing
and Real Estate and Eliminations, reclassifi cations and Corporate Treasury
components as disclosed in Segment Information to the corresponding consolidated
amount for the Company and to net cash provided by operating activities as pre-
sented in the Siemens Consolidated Statements of Cash Flow. In addition, Additions
to intangible assets and property, plant and equipment and Amorti zation, depreci-
ation and impairments of the Operations, Financing and Real Estate and Elimi-
nations, reclassifi cations and Corporate Treasury components as disclosed in
Segment Information are reconciled to Siemens Consolidated Statements of Cash
Flow.
September 30,
2007 2006
Total assets of Operations 87,658 80,019
Asset-based adjustments:
Intragroup fi nancing receivables and investments (10,834) (16,028)
Tax-related assets (2,845) (3,786)
Liability-based adjustments:
Pension plans and similar commitments (2,779) (5,081)
Liabilities (38,398) (37,133)
Assets classifi ed as held for disposal and associated liabilities (7,576) (1,993)
Other adjustments – (3,575)
Total adjustments (line item Other assets related and miscellaneous
reconciling items within the Segment Information table) (62,432) (67,596)
Net capital employed of Corporate items, pensions and eliminations 3,536 6,392
Net capital employed of Operations Groups 28,762 18,815