Siemens 2007 Annual Report Download - page 296
Download and view the complete annual report
Please find page 296 of the 2007 Siemens annual report below. You can navigate through the pages in the report by either clicking on the pages listed below, or by using the keyword search tool below to find specific information within the annual report.-
 1
1 -
2
-
3
-
4
-
5
-
6
-
7
-
8
-
9
-
10
-
11
-
12
-
13
-
14
-
15
-
16
-
17
-
18
-
19
-
20
-
21
-
22
-
23
-
24
-
25
-
26
-
27
-
28
-
29
-
30
-
31
-
32
-
33
-
34
-
35
-
36
-
37
-
38
-
39
-
40
-
41
-
42
-
43
-
44
-
45
-
46
-
47
-
48
-
49
-
50
-
51
-
52
-
53
-
54
-
55
-
56
-
57
-
58
-
59
-
60
-
61
-
62
-
63
-
64
-
65
-
66
-
67
-
68
-
69
-
70
-
71
-
72
-
73
-
74
-
75
-
76
-
77
-
78
-
79
-
80
-
81
-
82
-
83
-
84
-
85
-
86
-
87
-
88
-
89
-
90
-
91
-
92
-
93
-
94
-
95
-
96
-
97
-
98
-
99
-
100
-
101
-
102
-
103
-
104
-
105
-
106
-
107
-
108
-
109
-
110
-
111
-
112
-
113
-
114
-
115
-
116
-
117
-
118
-
119
-
120
-
121
-
122
-
123
-
124
-
125
-
126
-
127
-
128
-
129
-
130
-
131
-
132
-
133
-
134
-
135
-
136
-
137
-
138
-
139
-
140
-
141
-
142
-
143
-
144
-
145
-
146
-
147
-
148
-
149
-
150
-
151
-
152
-
153
-
154
-
155
-
156
-
157
-
158
-
159
-
160
-
161
-
162
-
163
-
164
-
165
-
166
-
167
-
168
-
169
-
170
-
171
-
172
-
173
-
174
-
175
-
176
-
177
-
178
-
179
-
180
-
181
-
182
-
183
-
184
-
185
-
186
-
187
-
188
-
189
-
190
-
191
-
192
-
193
-
194
-
195
-
196
-
197
-
198
-
199
-
200
-
201
-
202
-
203
-
204
-
205
-
206
-
207
-
208
-
209
-
210
-
211
-
212
-
213
-
214
-
215
-
216
-
217
-
218
-
219
-
220
-
221
-
222
-
223
-
224
-
225
-
226
-
227
-
228
-
229
-
230
-
231
-
232
-
233
-
234
-
235
-
236
-
237
-
238
-
239
-
240
-
241
-
242
-
243
-
244
-
245
-
246
-
247
-
248
-
249
-
250
-
251
-
252
-
253
-
254
-
255
-
256
-
257
-
258
-
259
-
260
-
261
-
262
-
263
-
264
-
265
-
266
-
267
-
268
-
269
-
270
-
271
-
272
-
273
-
274
-
275
-
276
-
277
-
278
-
279
-
280
-
281
-
282
-
283
-
284
-
285
-
 286
286 -
 287
287 -
 288
288 -
 289
289 -
 290
290 -
 291
291 -
 292
292 -
 293
293 -
 294
294 -
 295
295 -
 296
296 -
 297
297 -
 298
298 -
 299
299 -
 300
300 -
 301
301 -
 302
302 -
 303
303 -
 304
304 -
 305
305 -
 306
306 -
307
-
308
-
309
-
310
-
311
-
312
-
313
-
314
-
315
-
316
-
317
-
318
-
319
-
320
-
321
-
322
-
323
-
324
-
325
-
326
-
327
-
328
-
329
-
330
-
331
-
332
-
333
-
334
-
335
-
336
 |
 |

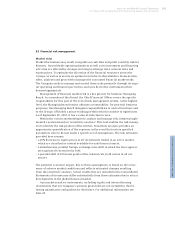
296 Notes to Consolidated Financial Statements
(in millions of €, except where otherwise stated and per share amounts)
The tables below show the net foreign exchange transaction exposure by major
currencies as of September 30, 2007 and 2006. In some currencies Siemens has
both substantial sales and costs, which have been off-set in the table:
Effects of currency translation
Many Siemens subsidiaries are located outside the Euro zone. Since the fi nancial
reporting currency of Siemens is the Euro, the fi nancial statements of these sub-
sidiaries are translated into euros so that the fi nancial results can be included in
the Consolidated Financial Statements of Siemens. To consider the effects of for-
eign exchange translation risk within risk management, the assumption is that
investments in foreign-based operations are permanent and that reinvestment is
continuous. Whenever a divestment of a particular asset or entity is made, the
value of this transaction risk is included in the sensitivity analyses. Effects from
currency fl uctuations on the translation of net asset amounts into Euro are
refl ected in the Company’s consolidated equity position.
September 30, 2007*
USD GBP Other Total
Gross balance sheet exposure 223 321 208 752
Thereof: Financial assets 7,858 3,642 4,769 16,269
Thereof: Financial liabilities (7,635) (3,321) (4,561) (15,517)
Gross exposure from fi rm commitments
and anticipated transactions 3,730 392 1,193 5,315
Foreign exchange transaction exposure 3,952 713 1,398 6,063
Economically hedged exposure (3,893) (567) (1,132) (5,592)
Change in future cash fl ows after hedging activities
resulting from a 10% appreciation of the Euro (6) (15) (27) (47)
September 30, 2006*
USD GBP Other Total
Gross balance sheet exposure 2,210 332 553 3,095
Thereof: Financial assets 13,778 3,483 5,522 22,783
Thereof: Financial liabilities (11,568) (3,151) (4,969) (19,688)
Gross exposure from fi rm commitments
and anticipated transactions 5,344 (65) 279 5,558
Foreign exchange transaction exposure 7,554 267 832 8,653
Economically hedged exposure (7,291) (409) (576) (8,276)
Change in future cash fl ows after hedging activities
resulting from a 10% appreciation of the Euro (26) 14 (26) (38)
* Including SV.