Siemens 2007 Annual Report Download - page 121
Download and view the complete annual report
Please find page 121 of the 2007 Siemens annual report below. You can navigate through the pages in the report by either clicking on the pages listed below, or by using the keyword search tool below to find specific information within the annual report.-
 1
1 -
2
-
3
-
4
-
5
-
6
-
7
-
8
-
9
-
10
-
11
-
12
-
13
-
14
-
15
-
16
-
17
-
18
-
19
-
20
-
21
-
22
-
23
-
24
-
25
-
26
-
27
-
28
-
29
-
30
-
31
-
32
-
33
-
34
-
35
-
36
-
37
-
38
-
39
-
40
-
41
-
42
-
43
-
44
-
45
-
46
-
47
-
48
-
49
-
50
-
51
-
52
-
53
-
54
-
55
-
56
-
57
-
58
-
59
-
60
-
61
-
62
-
63
-
64
-
65
-
66
-
67
-
68
-
69
-
70
-
71
-
72
-
73
-
74
-
75
-
76
-
77
-
78
-
79
-
80
-
81
-
82
-
83
-
84
-
85
-
86
-
87
-
88
-
89
-
90
-
91
-
92
-
93
-
94
-
95
-
96
-
97
-
98
-
99
-
100
-
101
-
102
-
103
-
104
-
105
-
106
-
107
-
108
-
109
-
110
-
 111
111 -
 112
112 -
 113
113 -
 114
114 -
 115
115 -
 116
116 -
 117
117 -
 118
118 -
 119
119 -
 120
120 -
 121
121 -
 122
122 -
 123
123 -
 124
124 -
 125
125 -
 126
126 -
 127
127 -
 128
128 -
 129
129 -
 130
130 -
 131
131 -
132
-
133
-
134
-
135
-
136
-
137
-
138
-
139
-
140
-
141
-
142
-
143
-
144
-
145
-
146
-
147
-
148
-
149
-
150
-
151
-
152
-
153
-
154
-
155
-
156
-
157
-
158
-
159
-
160
-
161
-
162
-
163
-
164
-
165
-
166
-
167
-
168
-
169
-
170
-
171
-
172
-
173
-
174
-
175
-
176
-
177
-
178
-
179
-
180
-
181
-
182
-
183
-
184
-
185
-
186
-
187
-
188
-
189
-
190
-
191
-
192
-
193
-
194
-
195
-
196
-
197
-
198
-
199
-
200
-
201
-
202
-
203
-
204
-
205
-
206
-
207
-
208
-
209
-
210
-
211
-
212
-
213
-
214
-
215
-
216
-
217
-
218
-
219
-
220
-
221
-
222
-
223
-
224
-
225
-
226
-
227
-
228
-
229
-
230
-
231
-
232
-
233
-
234
-
235
-
236
-
237
-
238
-
239
-
240
-
241
-
242
-
243
-
244
-
245
-
246
-
247
-
248
-
249
-
250
-
251
-
252
-
253
-
254
-
255
-
256
-
257
-
258
-
259
-
260
-
261
-
262
-
263
-
264
-
265
-
266
-
267
-
268
-
269
-
270
-
271
-
272
-
273
-
274
-
275
-
276
-
277
-
278
-
279
-
280
-
281
-
282
-
283
-
284
-
285
-
286
-
287
-
288
-
289
-
290
-
291
-
292
-
293
-
294
-
295
-
296
-
297
-
298
-
299
-
300
-
301
-
302
-
303
-
304
-
305
-
306
-
307
-
308
-
309
-
310
-
311
-
312
-
313
-
314
-
315
-
316
-
317
-
318
-
319
-
320
-
321
-
322
-
323
-
324
-
325
-
326
-
327
-
328
-
329
-
330
-
331
-
332
-
333
-
334
-
335
-
336
 |
 |

Management’s discussion and analysis 121
Management’s discussion and analysis
Gross profi t for fi scal 2007 increased 20% year-over-year, as all Groups in
Operations increased gross profi t. Gross profi t margin increased to 28.8% from
26.1% a year earlier. This increase is due to improved gross profi t margins over all
groups, especially at SIS, benefi ting from an improved cost structure following
severance charges in the prior year.
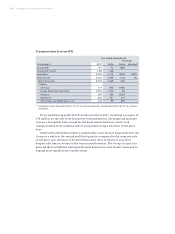
Research and development expenses increased to €3.399 billion, led by higher
outlays at Med and A&D. Despite the increase in our revenue year-over-year, R&D
expenses as a percent of revenue increased slightly to 4.7% from 4.6% in fi scal
2006. For additional information with respect to R&D, see “Research and Develop-
ment” and “Notes to Consolidated Financial Statements.” Marketing, selling and
general administrative expenses declined as a percent of revenue, to 16.7% from
17.9% a year earlier, due to the substantial increase in our revenue year-over-year.
Other operating income was €680 million in fi scal 2007, compared to €629 mil-
lion a year earlier. Gains on sales of property, plant and equipment and intangi-
bles increased from €208 million in fi scal 2006 to €289 million in fi scal 2007. In
fi scal 2007, gains on disposals of businesses were €196 million, benefi ting from a
sale of a locomotive leasing business at TS, compared to €55 million in the prior
year. Fiscal 2006 included a gain of €70 million related to the settlement of an
arbitration proceeding.
Other operating expense increased signifi cantly from €260 million in fi scal
2006 to €1.053 billion in fi scal 2007. The change year-over-year is due to expenses
related to major legal and regulatory matters in the current period. This included
€440 million stemming from sanctions on major suppliers of gas-isolated switch-
gear, and €152 million in expenses for external advisors and consultants related
to legal and compliance issues, as well as €81 million in funding primarily for job
placement companies for former Siemens employees affected by the bankruptcy of
BenQ Mobile GmbH & Co. OHG (BenQ). Other operating expense in fi scal 2007 also
included €60 million for goodwill impairment.
Year ended
September 30,
(€ in millions) 2007 2006 % Change
Research and development expenses (3,399) (3,091) 10%
as percentage of revenue 4.7% 4.6% –
Marketing, selling and general administrative expenses (12,103) (11,897) 2%
as percentage of revenue 16.7% 17.9% –
Other operating income 680 629 8%
Other operating expense (1,053) (260) 305%
Income from investments accounted
for using the equity method, net 108 404 (73)%
Financial income (expense), net (8) 254 –