Siemens 2010 Annual Report Download - page 144
Download and view the complete annual report
Please find page 144 of the 2010 Siemens annual report below. You can navigate through the pages in the report by either clicking on the pages listed below, or by using the keyword search tool below to find specific information within the annual report.-
 1
1 -
2
-
3
-
4
-
5
-
6
-
7
-
8
-
9
-
10
-
11
-
12
-
13
-
14
-
15
-
16
-
17
-
18
-
19
-
20
-
21
-
22
-
23
-
24
-
25
-
26
-
27
-
28
-
29
-
30
-
31
-
32
-
33
-
34
-
35
-
36
-
37
-
38
-
39
-
40
-
41
-
42
-
43
-
44
-
45
-
46
-
47
-
48
-
49
-
50
-
51
-
52
-
53
-
54
-
55
-
56
-
57
-
58
-
59
-
60
-
61
-
62
-
63
-
64
-
65
-
66
-
67
-
68
-
69
-
70
-
71
-
72
-
73
-
74
-
75
-
76
-
77
-
78
-
79
-
80
-
81
-
82
-
83
-
84
-
85
-
86
-
87
-
88
-
89
-
90
-
91
-
92
-
93
-
94
-
95
-
96
-
97
-
98
-
99
-
100
-
101
-
102
-
103
-
104
-
105
-
106
-
107
-
108
-
109
-
110
-
111
-
112
-
113
-
114
-
115
-
116
-
117
-
118
-
119
-
120
-
121
-
122
-
123
-
124
-
125
-
126
-
127
-
128
-
129
-
130
-
131
-
132
-
133
-
 134
134 -
 135
135 -
 136
136 -
 137
137 -
 138
138 -
 139
139 -
 140
140 -
 141
141 -
 142
142 -
 143
143 -
 144
144 -
 145
145 -
 146
146 -
 147
147 -
 148
148 -
 149
149 -
 150
150 -
 151
151 -
 152
152 -
 153
153 -
 154
154 -
155
-
156
-
157
-
158
-
159
-
160
-
161
-
162
-
163
-
164
-
165
-
166
-
167
-
168
-
169
-
170
-
171
-
172
-
173
-
174
-
175
-
176
-
177
-
178
-
179
-
180
-
181
-
182
-
183
-
184
-
185
-
186
-
187
-
188
-
189
-
190
-
191
-
192
-
193
-
194
-
195
-
196
-
197
-
198
-
199
-
200
-
201
-
202
-
203
-
204
-
205
-
206
-
207
-
208
-
209
-
210
-
211
-
212
-
213
-
214
-
215
-
216
-
217
-
218
-
219
-
220
-
221
-
222
-
223
-
224
-
225
-
226
-
227
-
228
-
229
-
230
-
231
-
232
-
233
-
234
-
235
-
236
-
237
-
238
-
239
-
240
-
241
-
242
-
243
-
244
-
245
-
246
-
247
-
248
-
249
-
250
-
251
-
252
-
253
-
254
-
255
-
256
-
257
-
258
-
259
-
260
-
261
-
262
-
263
-
264
-
265
-
266
-
267
-
268
-
269
-
270
-
271
-
272
-
273
-
274
-
275
-
276
-
277
-
278
-
279
-
280
-
281
-
282
-
283
-
284
-
285
-
286
-
287
-
288
-
289
-
290
-
291
-
292
-
293
-
294
-
295
-
296
-
297
-
298
-
299
-
300
-
301
-
302
-
303
-
304
-
305
-
306
-
307
-
308
-
309
-
310
-
311
-
312
-
313
-
314
-
315
-
316
-
317
-
318
-
319
-
320
-
321
-
322
-
323
-
324
-
325
-
326
-
327
-
328
-
329
-
330
-
331
-
332
-
333
-
334
-
335
-
336
-
337
-
338
-
339
-
340
-
341
-
342
-
343
-
344
 |
 |

6 To our shareholders 21 Corporate Governance 49 Combined management’s discussion and analysis
50 Business and operating environment
78 Fiscal – Financial summary
81 Results of operations
98 Financial position
110 Net assets position
113 Overall assessment of the economic position
Fiscal – Financial summary
In fiscal , we emerged from the economic downturn as a
more focused company with strong operating momentum. Net
income and Total Sectors profit climbed above the prior-year
levels, and all three Sectors generated strong increases in Free
cash flow which resulted in a substantial increase in Free cash
flow for Siemens compared to the prior year. We also restored
order growth following the economic downturn, particularly in
our shorter-cycle businesses, and kept revenue almost level
with the prior year in part by steadily converting orders from
our strong order backlog into current business. Order develop-
ment was clearly more robust in the second half of fiscal
than in the first half, as our Sectors took advantage of improv-
ing market conditions.
Among other portfolio activities during fiscal , we
launched a strategic reorientation of our IT business aimed at
improving its competitive strength. Furthermore, we reas-
sessed the growth potential of the businesses we previously
acquired to form our Diagnostics Division. Both steps led to
burdens on reported income for the fiscal year. Charges for
completion of staff reduction measures resulted in a loss at
Siemens IT Solutions and Services, and a substantial goodwill
impairment at Diagnostics resulted in lower profit for the
Healthcare Sector compared to fiscal .
We kept revenue stable year-over-year. At the Sector level,
revenue was nearly unchanged compared to fiscal . Indus-
try, our largest Sector by volume, offset declines in its longer-
cycle businesses with revenue growth in faster-recovering,
shorter-cycle businesses. Healthcare revenue increased steadi-
ly throughout the year, and came in above the prior-year level.
Revenue at Energy was down in the first half of the fiscal year,
but recovered well in the second half. The modest revenue
decline for Siemens overall was due mainly to lower revenue
at Siemens IT Solutions and Services and streamlining of Cen-
trally managed portfolio activities. Revenue in fiscal
benefited from positive currency translation effects. On a geo-
graphic basis, revenue rose % in Asia, Australia. This offset
much of the decline in revenue in the much larger region Eu-
rope, C.I.S., Africa, and the Middle East. Revenue in the Ameri-
cas was nearly unchanged, as double-digit growth in the re-
gion’s emerging markets largely offset a decrease in the U.S.
We restored order growth. The patterns described above for
revenue development in the Sectors were also evident in order
development. Industry ’s shorter-cycle businesses delivered
the majority of the Sector’s order growth year-over-year, and
Energy ’s strong second half included high double-digit growth
in the fourth quarter compared to the prior-year quarter.
Healthcare orders rose steadily through the year. Order devel-
opment differed somewhat from revenue on a geographic ba-
sis. Orders climbed % in the Americas, with both the U.S. and
emerging markets showing double-digit increases. Asia, Aus-
tralia saw solid order growth, and together these regions offset
lower orders in Europe, C.I.S., Africa, Middle East.
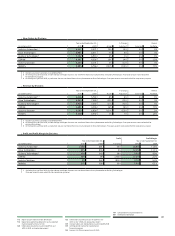
Revenue (in millions of €)
Siemens Industry
Sector
Energy
Sector
Healthcare
Sector
FY 2010 FY 2009
1 Includes intersegment revenue.
75,978 76,651 34,869 35,043 25,520 25,793 12,364 11,927
(1)%
4%
(1)%
0%
New Orders (in millions of €)
Siemens Industry
Sector
Energy
Sector
Healthcare
Sector
FY 2010 FY 2009
1 Includes intersegment orders.
81,163 78,991 34,908 33,284 30,122 30,076 12,872 11,950
0%
8%
3%
5%