Siemens 2010 Annual Report Download - page 145
Download and view the complete annual report
Please find page 145 of the 2010 Siemens annual report below. You can navigate through the pages in the report by either clicking on the pages listed below, or by using the keyword search tool below to find specific information within the annual report.-
 1
1 -
2
-
3
-
4
-
5
-
6
-
7
-
8
-
9
-
10
-
11
-
12
-
13
-
14
-
15
-
16
-
17
-
18
-
19
-
20
-
21
-
22
-
23
-
24
-
25
-
26
-
27
-
28
-
29
-
30
-
31
-
32
-
33
-
34
-
35
-
36
-
37
-
38
-
39
-
40
-
41
-
42
-
43
-
44
-
45
-
46
-
47
-
48
-
49
-
50
-
51
-
52
-
53
-
54
-
55
-
56
-
57
-
58
-
59
-
60
-
61
-
62
-
63
-
64
-
65
-
66
-
67
-
68
-
69
-
70
-
71
-
72
-
73
-
74
-
75
-
76
-
77
-
78
-
79
-
80
-
81
-
82
-
83
-
84
-
85
-
86
-
87
-
88
-
89
-
90
-
91
-
92
-
93
-
94
-
95
-
96
-
97
-
98
-
99
-
100
-
101
-
102
-
103
-
104
-
105
-
106
-
107
-
108
-
109
-
110
-
111
-
112
-
113
-
114
-
115
-
116
-
117
-
118
-
119
-
120
-
121
-
122
-
123
-
124
-
125
-
126
-
127
-
128
-
129
-
130
-
131
-
132
-
133
-
134
-
 135
135 -
 136
136 -
 137
137 -
 138
138 -
 139
139 -
 140
140 -
 141
141 -
 142
142 -
 143
143 -
 144
144 -
 145
145 -
 146
146 -
 147
147 -
 148
148 -
 149
149 -
 150
150 -
 151
151 -
 152
152 -
 153
153 -
 154
154 -
 155
155 -
156
-
157
-
158
-
159
-
160
-
161
-
162
-
163
-
164
-
165
-
166
-
167
-
168
-
169
-
170
-
171
-
172
-
173
-
174
-
175
-
176
-
177
-
178
-
179
-
180
-
181
-
182
-
183
-
184
-
185
-
186
-
187
-
188
-
189
-
190
-
191
-
192
-
193
-
194
-
195
-
196
-
197
-
198
-
199
-
200
-
201
-
202
-
203
-
204
-
205
-
206
-
207
-
208
-
209
-
210
-
211
-
212
-
213
-
214
-
215
-
216
-
217
-
218
-
219
-
220
-
221
-
222
-
223
-
224
-
225
-
226
-
227
-
228
-
229
-
230
-
231
-
232
-
233
-
234
-
235
-
236
-
237
-
238
-
239
-
240
-
241
-
242
-
243
-
244
-
245
-
246
-
247
-
248
-
249
-
250
-
251
-
252
-
253
-
254
-
255
-
256
-
257
-
258
-
259
-
260
-
261
-
262
-
263
-
264
-
265
-
266
-
267
-
268
-
269
-
270
-
271
-
272
-
273
-
274
-
275
-
276
-
277
-
278
-
279
-
280
-
281
-
282
-
283
-
284
-
285
-
286
-
287
-
288
-
289
-
290
-
291
-
292
-
293
-
294
-
295
-
296
-
297
-
298
-
299
-
300
-
301
-
302
-
303
-
304
-
305
-
306
-
307
-
308
-
309
-
310
-
311
-
312
-
313
-
314
-
315
-
316
-
317
-
318
-
319
-
320
-
321
-
322
-
323
-
324
-
325
-
326
-
327
-
328
-
329
-
330
-
331
-
332
-
333
-
334
-
335
-
336
-
337
-
338
-
339
-
340
-
341
-
342
-
343
-
344
 |
 |

113 Report on post-balance sheet date events
114 Report on expected developments and associated
material opportunities and risks
128 Information required pursuant to § () and
§ () HGB and explanatory report
133 Information required pursuant to § () and
§ () no. HGB and explanatory report
135 Compensation and declaration pursuant to §a HGB
135 Additional information for supplemental
financial measures
138 Siemens AG (Discussion on basis of HGB)
147 Consolidated Financial Statements
261 Additional information
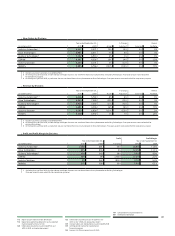
We increased Total Sectors profit to €. billion. The Sec-
tors’ combined profit came in % higher than the prior year,
even after €. billion in impairment charges at Healthcare’s
Diagnostics Division in the fourth quarter. Industry took
its profit up % year-over-year, as successful profitability ini-
tiatives improved capacity utilization and reduced costs. En-
ergy generated a % profit increase compared to the prior fiscal
year on strong project execution. Profit at Healthcare was sig-
nificantly lower due to the impairment charges mentioned
above.
During the fourth quarter of fiscal we completed a strate-
gic review that reassessed the medium-term growth prospects
and long-term market development of the laboratory diagnos-
tics business, and subsequently announced a preliminary esti-
mate of goodwill impairment charges. Following completion of
the annual impairment test, Diagnostics took impairment
charges at the close of the fourth quarter of €. billion, in-
cluding €. billion for goodwill, below the previously an-
nounced estimate primarily due to currency translation effects.
In fiscal , Corporate items included expenses of € mil-
lion related to special remuneration for non-management
employees. Once the allocation of the remuneration is deter-
mined in the first quarter of fiscal , the expenses will be
allocated primarily to the Sectors in fiscal .
Income from continuing operations rose substantially.
Total
Sectors profit in fiscal came in higher despite the above-
mentioned impairment charges related to Healthcare’s Diag-
nostics Division while burdens below the Sectors were lower in
the current fiscal year than in fiscal . These factors com-
bined to increase income from continuing operations to €.
billion. Basic earnings per share (EPS) from continuing opera-
tions rose to €.. A year earlier, income from continuing
operations was €. billion and basic EPS from continuing
operations was €.. The difference year-over-year was due
mainly to Equity Investments, which had a loss of € million
in fiscal compared to a loss of €. billion in fiscal .
The loss in the prior-year period included impairment charges
related to NSN of €. billion, primarily involving the €.
billion impairment of our stake in NSN. The lower loss from
Equity Investments in fiscal was partly offset by a loss of
€ million (pre-tax) at Siemens IT Solutions and Services,
which posted a profit of € million (pre-tax) a year earlier. The
loss in the current period stemmed from a strategic reorienta-
tion aimed at strengthening the competitive position of the
business in preparation for operating on a standalone basis,
including reorganization of solutions, outsourcing and soft-
ware activities. Completing previously announced staff reduc-
tions occasioned charges of € million (pre-tax) in fiscal
, and we also took charges of € million (pre-tax) within
Corporate items, primarily relating to the carve-out of Siemens
IT Solutions and Services as a separate legal entity which is a
wholly owned consolidated subsidiary of Siemens as of Octo-
ber , . Net Income rose to €. billion, up from €.
billion. Basic EPS was €. compared to €. in fiscal .
We generated substantial cash flow from continuing opera-
tions.
A strong cash performance in the Sectors, particularly in
the second half of the fiscal year, drove Free cash flow from
continuing operations up to €. billion. Besides a strong
operating performance in the Sectors, cash flow from operat-
ing activities also benefited from positive changes in net work-
ing capital including substantially higher billings in excess of
costs, particularly in the Energy Sector, compared to a decrease
Profit Sectors (in millions of €)
Total Sectors
Profit
Industry
Sector
Energy
Sector
Healthcare
Sector
FY 2010 FY 2009
7,789 7,466 3,478 2,701 3,562 3,315 748 1,450
7%
(48)%
4%
29%
Income and Profit (in millions of €)
Total
Sectors Profit
Income from
continuing operations
Net income
FY 2010 FY 2009
2,4574,112 2,497
4,068
7,789 7,466
4%
67% 63%