Siemens 2010 Annual Report Download - page 151
Download and view the complete annual report
Please find page 151 of the 2010 Siemens annual report below. You can navigate through the pages in the report by either clicking on the pages listed below, or by using the keyword search tool below to find specific information within the annual report.-
 1
1 -
2
-
3
-
4
-
5
-
6
-
7
-
8
-
9
-
10
-
11
-
12
-
13
-
14
-
15
-
16
-
17
-
18
-
19
-
20
-
21
-
22
-
23
-
24
-
25
-
26
-
27
-
28
-
29
-
30
-
31
-
32
-
33
-
34
-
35
-
36
-
37
-
38
-
39
-
40
-
41
-
42
-
43
-
44
-
45
-
46
-
47
-
48
-
49
-
50
-
51
-
52
-
53
-
54
-
55
-
56
-
57
-
58
-
59
-
60
-
61
-
62
-
63
-
64
-
65
-
66
-
67
-
68
-
69
-
70
-
71
-
72
-
73
-
74
-
75
-
76
-
77
-
78
-
79
-
80
-
81
-
82
-
83
-
84
-
85
-
86
-
87
-
88
-
89
-
90
-
91
-
92
-
93
-
94
-
95
-
96
-
97
-
98
-
99
-
100
-
101
-
102
-
103
-
104
-
105
-
106
-
107
-
108
-
109
-
110
-
111
-
112
-
113
-
114
-
115
-
116
-
117
-
118
-
119
-
120
-
121
-
122
-
123
-
124
-
125
-
126
-
127
-
128
-
129
-
130
-
131
-
132
-
133
-
134
-
135
-
136
-
137
-
138
-
139
-
140
-
 141
141 -
 142
142 -
 143
143 -
 144
144 -
 145
145 -
 146
146 -
 147
147 -
 148
148 -
 149
149 -
 150
150 -
 151
151 -
 152
152 -
 153
153 -
 154
154 -
 155
155 -
 156
156 -
 157
157 -
 158
158 -
 159
159 -
 160
160 -
 161
161 -
162
-
163
-
164
-
165
-
166
-
167
-
168
-
169
-
170
-
171
-
172
-
173
-
174
-
175
-
176
-
177
-
178
-
179
-
180
-
181
-
182
-
183
-
184
-
185
-
186
-
187
-
188
-
189
-
190
-
191
-
192
-
193
-
194
-
195
-
196
-
197
-
198
-
199
-
200
-
201
-
202
-
203
-
204
-
205
-
206
-
207
-
208
-
209
-
210
-
211
-
212
-
213
-
214
-
215
-
216
-
217
-
218
-
219
-
220
-
221
-
222
-
223
-
224
-
225
-
226
-
227
-
228
-
229
-
230
-
231
-
232
-
233
-
234
-
235
-
236
-
237
-
238
-
239
-
240
-
241
-
242
-
243
-
244
-
245
-
246
-
247
-
248
-
249
-
250
-
251
-
252
-
253
-
254
-
255
-
256
-
257
-
258
-
259
-
260
-
261
-
262
-
263
-
264
-
265
-
266
-
267
-
268
-
269
-
270
-
271
-
272
-
273
-
274
-
275
-
276
-
277
-
278
-
279
-
280
-
281
-
282
-
283
-
284
-
285
-
286
-
287
-
288
-
289
-
290
-
291
-
292
-
293
-
294
-
295
-
296
-
297
-
298
-
299
-
300
-
301
-
302
-
303
-
304
-
305
-
306
-
307
-
308
-
309
-
310
-
311
-
312
-
313
-
314
-
315
-
316
-
317
-
318
-
319
-
320
-
321
-
322
-
323
-
324
-
325
-
326
-
327
-
328
-
329
-
330
-
331
-
332
-
333
-
334
-
335
-
336
-
337
-
338
-
339
-
340
-
341
-
342
-
343
-
344
 |
 |

113 Report on post-balance sheet date events
114 Report on expected developments and associated
material opportunities and risks
128 Information required pursuant to § () and
§ () HGB and explanatory report
133 Information required pursuant to § () and
§ () no. HGB and explanatory report
135 Compensation and declaration pursuant to §a HGB
135 Additional information for supplemental
financial measures
138 Siemens AG (Discussion on basis of HGB)
147 Consolidated Financial Statements
261 Additional information
Income from continuing operations before income taxes
was €. billion for the current fiscal year, compared to
€. billion a year earlier. The improvement year-over-year
was due to the factors mentioned above, primarily including
higher gross profit in all Sectors and an improved financial re-
sult in fiscal , partly offset by charges related to the strate-
gic reorientation of Siemens IT Solutions and Services. While
both periods included major impairments as noted above, the
impact on income from continuing operations was lower in
fiscal . The effective tax rate was % in fiscal , down
from % in the prior year. The current-year rate was adversely
affected by the goodwill impairment charges at the Diagnos-
tics Division, a majority of which was not deductible for tax
purposes. This effect was more than offset by the release of tax
provisions after the conclusion of tax audits, and the release of
tax liabilities after the positive decision on appeal related to
non-deductible expenses in connection with certain foreign
dividends. For comparison, the prior-year rate was adversely
affected by the significant Loss from investments accounted
for using the equity method, net, primarily due to NSN, partly
offset by the tax-free gain on the sale of our stake in FSC. As a
result, Income from continuing operations after taxes was
€. billion in fiscal , up from €. billion in the prior-
year period.
Discontinued operations primarily include former Com ac-
tivities, comprising telecommunications carrier activities
transferred into NSN in the third quarter of fiscal ; the
enterprise networks business, % of which was divested dur-
ing the fourth quarter of fiscal ; and the mobile devices
business sold to BenQ Corporation in fiscal . Income from
discontinued operations in fiscal was a negative € mil-
lion, including charges related to legal and regulatory matters,
compared to a positive € million a year earlier. For additional
information regarding discontinued operations, see “Notes to
Consolidated Financial Statements.”
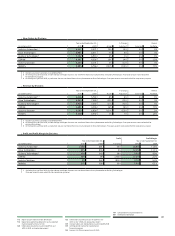
Reconciliation for Consolidated Statements of Income (in billions of €)
FY FY FY
Revenue 76.0 76.7 77.3
Cost of goods sold (54.3) (55.9) (56.3)
Gross profit 21.6 20.7 21.0
R&D expenses (3.8) (3.9) (3.8)
SG&A expenses (11.1) (10.9) (13.6)
Other / Taxes (2.6) (3.5) (1.8)
Income4.1 2.5 1.9
All percentage figures in % of Revenue.
1 Continuing operations
73%
73%
72%
5%
5%
5%
2%
3%
5%
27%
27%
28%
18%
14%
15%
Income from investments accounted for using the equity
method, net was a negative € million, compared to a nega-
tive €. billion in fiscal . The difference was due pri-
marily to an equity investment loss of €. billion in the prior
year related to NSN. This equity investment loss included an
impairment of €. billion on our stake in NSN recorded in
the fourth quarter and a loss of € million, including a
charge of € million related to an impairment of deferred tax
assets at NSN as well as our share of restructuring and integra-
tion costs. In addition, the prior year included an equity invest-
ment loss of € million related to Enterprise Networks Hold-
ings B.V. (EN). For comparison, Income from investments ac-
counted for using the equity method, net in fiscal
included an investment loss of € million related to NSN.
Further, equity investment income related to our stakes in BSH
and KMW improved to a total of € million in fiscal from
a total of € million a year earlier.
Interest income increased slightly to €. billion in fiscal
, from €. billion a year earlier. Interest expense was
€. billion, down from €. billion in fiscal . The de-
cline in interest expense was due in part to lower interest rates
compared to the prior year.
Other financial income (expense), net
was a negative €
million in fiscal compared to a negative € million in
the prior-year period. The difference was due primarily to
higher expenses in fiscal as a result of allowances and
write-offs of finance receivables, net of reversals. These net
expenses amounted to € million in fiscal , compared to
€ million a year earlier. In addition, fiscal included
higher income from available-for-sale financial assets, includ-
ing a gain of € million from the sale of a stake in an invest-
ment at SFS. These factors were partly offset by higher losses
year-over-year related to interest rate derivatives not qualifying
for hedge accounting.