Siemens 2010 Annual Report Download - page 294
Download and view the complete annual report
Please find page 294 of the 2010 Siemens annual report below. You can navigate through the pages in the report by either clicking on the pages listed below, or by using the keyword search tool below to find specific information within the annual report.-
 1
1 -
2
-
3
-
4
-
5
-
6
-
7
-
8
-
9
-
10
-
11
-
12
-
13
-
14
-
15
-
16
-
17
-
18
-
19
-
20
-
21
-
22
-
23
-
24
-
25
-
26
-
27
-
28
-
29
-
30
-
31
-
32
-
33
-
34
-
35
-
36
-
37
-
38
-
39
-
40
-
41
-
42
-
43
-
44
-
45
-
46
-
47
-
48
-
49
-
50
-
51
-
52
-
53
-
54
-
55
-
56
-
57
-
58
-
59
-
60
-
61
-
62
-
63
-
64
-
65
-
66
-
67
-
68
-
69
-
70
-
71
-
72
-
73
-
74
-
75
-
76
-
77
-
78
-
79
-
80
-
81
-
82
-
83
-
84
-
85
-
86
-
87
-
88
-
89
-
90
-
91
-
92
-
93
-
94
-
95
-
96
-
97
-
98
-
99
-
100
-
101
-
102
-
103
-
104
-
105
-
106
-
107
-
108
-
109
-
110
-
111
-
112
-
113
-
114
-
115
-
116
-
117
-
118
-
119
-
120
-
121
-
122
-
123
-
124
-
125
-
126
-
127
-
128
-
129
-
130
-
131
-
132
-
133
-
134
-
135
-
136
-
137
-
138
-
139
-
140
-
141
-
142
-
143
-
144
-
145
-
146
-
147
-
148
-
149
-
150
-
151
-
152
-
153
-
154
-
155
-
156
-
157
-
158
-
159
-
160
-
161
-
162
-
163
-
164
-
165
-
166
-
167
-
168
-
169
-
170
-
171
-
172
-
173
-
174
-
175
-
176
-
177
-
178
-
179
-
180
-
181
-
182
-
183
-
184
-
185
-
186
-
187
-
188
-
189
-
190
-
191
-
192
-
193
-
194
-
195
-
196
-
197
-
198
-
199
-
200
-
201
-
202
-
203
-
204
-
205
-
206
-
207
-
208
-
209
-
210
-
211
-
212
-
213
-
214
-
215
-
216
-
217
-
218
-
219
-
220
-
221
-
222
-
223
-
224
-
225
-
226
-
227
-
228
-
229
-
230
-
231
-
232
-
233
-
234
-
235
-
236
-
237
-
238
-
239
-
240
-
241
-
242
-
243
-
244
-
245
-
246
-
247
-
248
-
249
-
250
-
251
-
252
-
253
-
254
-
255
-
256
-
257
-
258
-
259
-
260
-
261
-
262
-
263
-
264
-
265
-
266
-
267
-
268
-
269
-
270
-
271
-
272
-
273
-
274
-
275
-
276
-
277
-
278
-
279
-
280
-
281
-
282
-
283
-
 284
284 -
 285
285 -
 286
286 -
 287
287 -
 288
288 -
 289
289 -
 290
290 -
 291
291 -
 292
292 -
 293
293 -
 294
294 -
 295
295 -
 296
296 -
 297
297 -
 298
298 -
 299
299 -
 300
300 -
 301
301 -
 302
302 -
 303
303 -
 304
304 -
305
-
306
-
307
-
308
-
309
-
310
-
311
-
312
-
313
-
314
-
315
-
316
-
317
-
318
-
319
-
320
-
321
-
322
-
323
-
324
-
325
-
326
-
327
-
328
-
329
-
330
-
331
-
332
-
333
-
334
-
335
-
336
-
337
-
338
-
339
-
340
-
341
-
342
-
343
-
344
 |
 |

6 To our shareholders 21 Corporate Governance 49 Combined management’s discussion and analysis
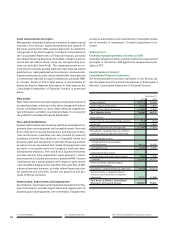
Details on option exercise activity and weighted average exer-
cise prices for the years ended September , and
are as follows:
Year ended Sept. , Year ended Sept. ,
Options Weighted
average
exercise
price
Weighted
average
remaining
contractual
term (years)
Aggregate
intrinsic value
in millions
of €
Options Weighted
average
exercise
price
Outstanding, beginning of period 2,627,742 €73.89 5,097,083 €73.60
Granted – – – –
Options exercised (687,605) €74.59 – –
Options expired (888,210) €72.54 (2,213,111) €73.25
Options forfeited (116,495) €74.42 (152,015) €73.81
Options settled – – (104,215) €73.39
Outstanding, end of period 935,432 €74.59 0.13 3 2,627,742 €73.89
Exercisable, end of period 935,432 €74.59 0.13 3 2,627,742 €73.89
As of September 30, 2009, for Options outstanding the weighted average remaining contractual term was 0.8 years; the aggregate intrinsic value amounted to €–.
The following table summarizes information on stock options
outstanding at September , and :
September , September ,
Exercise
prices
Number of
Options
outstanding
Weighted
average
remaining
life (years)
Number of
Options
outstanding
Weighted
average
remaining
life (years)
€72.54 – – 898,050 0.1
€74.59 935,432 0.1 1,729,692 1.1
Fair value information
The Company ’s determination of the fair value of stock option
grants is based on an option pricing model which was devel-
oped for use in estimating the fair values of options that have
no vesting restrictions. Option valuation models require the
input of highly subjective assumptions including the expected
stock price volatility. The fair value per option outstanding as
of September , amounts to €. for grants made in
fiscal .
II. Cash-settled awards
Stock appreciation rights (SARs)
Where local regulations restrict the grant of stock options in
certain jurisdictions, the Company grants SARs to employees
under the same conditions as the Siemens Stock Option
Plan except that SARs are exercisable in cash only.
Details on SARs activity and weighted average exercise prices
are summarized in the table below:
Year ended Sept. , Year ended Sept. ,
SARs Weighted
average
exercise
price
SARs Weighted
average
exercise
price
Outstanding,
beginning of period 54,945 €73.85 138,485 €73.58
Granted – – – –
SARs exercised – – – –
SARs forfeited /
settled / expired (21,500) 1 €72.69 (83,540) €73.41
Outstanding,
end of period 33,445 €74.59 54,945 €73.85
Exercisable,
end of period 33,445 €74.59 54,945 €73.85
1 Consists of 19,890 expired SARs with a weighted average exercise price of €72.54 and
1,610 settled SARs with a weighted average exercise price of €74.59 in fiscal 2010.