Siemens 2010 Annual Report Download - page 147
Download and view the complete annual report
Please find page 147 of the 2010 Siemens annual report below. You can navigate through the pages in the report by either clicking on the pages listed below, or by using the keyword search tool below to find specific information within the annual report.-
 1
1 -
2
-
3
-
4
-
5
-
6
-
7
-
8
-
9
-
10
-
11
-
12
-
13
-
14
-
15
-
16
-
17
-
18
-
19
-
20
-
21
-
22
-
23
-
24
-
25
-
26
-
27
-
28
-
29
-
30
-
31
-
32
-
33
-
34
-
35
-
36
-
37
-
38
-
39
-
40
-
41
-
42
-
43
-
44
-
45
-
46
-
47
-
48
-
49
-
50
-
51
-
52
-
53
-
54
-
55
-
56
-
57
-
58
-
59
-
60
-
61
-
62
-
63
-
64
-
65
-
66
-
67
-
68
-
69
-
70
-
71
-
72
-
73
-
74
-
75
-
76
-
77
-
78
-
79
-
80
-
81
-
82
-
83
-
84
-
85
-
86
-
87
-
88
-
89
-
90
-
91
-
92
-
93
-
94
-
95
-
96
-
97
-
98
-
99
-
100
-
101
-
102
-
103
-
104
-
105
-
106
-
107
-
108
-
109
-
110
-
111
-
112
-
113
-
114
-
115
-
116
-
117
-
118
-
119
-
120
-
121
-
122
-
123
-
124
-
125
-
126
-
127
-
128
-
129
-
130
-
131
-
132
-
133
-
134
-
135
-
136
-
 137
137 -
 138
138 -
 139
139 -
 140
140 -
 141
141 -
 142
142 -
 143
143 -
 144
144 -
 145
145 -
 146
146 -
 147
147 -
 148
148 -
 149
149 -
 150
150 -
 151
151 -
 152
152 -
 153
153 -
 154
154 -
 155
155 -
 156
156 -
 157
157 -
158
-
159
-
160
-
161
-
162
-
163
-
164
-
165
-
166
-
167
-
168
-
169
-
170
-
171
-
172
-
173
-
174
-
175
-
176
-
177
-
178
-
179
-
180
-
181
-
182
-
183
-
184
-
185
-
186
-
187
-
188
-
189
-
190
-
191
-
192
-
193
-
194
-
195
-
196
-
197
-
198
-
199
-
200
-
201
-
202
-
203
-
204
-
205
-
206
-
207
-
208
-
209
-
210
-
211
-
212
-
213
-
214
-
215
-
216
-
217
-
218
-
219
-
220
-
221
-
222
-
223
-
224
-
225
-
226
-
227
-
228
-
229
-
230
-
231
-
232
-
233
-
234
-
235
-
236
-
237
-
238
-
239
-
240
-
241
-
242
-
243
-
244
-
245
-
246
-
247
-
248
-
249
-
250
-
251
-
252
-
253
-
254
-
255
-
256
-
257
-
258
-
259
-
260
-
261
-
262
-
263
-
264
-
265
-
266
-
267
-
268
-
269
-
270
-
271
-
272
-
273
-
274
-
275
-
276
-
277
-
278
-
279
-
280
-
281
-
282
-
283
-
284
-
285
-
286
-
287
-
288
-
289
-
290
-
291
-
292
-
293
-
294
-
295
-
296
-
297
-
298
-
299
-
300
-
301
-
302
-
303
-
304
-
305
-
306
-
307
-
308
-
309
-
310
-
311
-
312
-
313
-
314
-
315
-
316
-
317
-
318
-
319
-
320
-
321
-
322
-
323
-
324
-
325
-
326
-
327
-
328
-
329
-
330
-
331
-
332
-
333
-
334
-
335
-
336
-
337
-
338
-
339
-
340
-
341
-
342
-
343
-
344
 |
 |

113 Report on post-balance sheet date events
114 Report on expected developments and associated
material opportunities and risks
128 Information required pursuant to § () and
§ () HGB and explanatory report
133 Information required pursuant to § () and
§ () no. HGB and explanatory report
135 Compensation and declaration pursuant to §a HGB
135 Additional information for supplemental
financial measures
138 Siemens AG (Discussion on basis of HGB)
147 Consolidated Financial Statements
261 Additional information
Results of operations
RESULTS OF SIEMENS
The following discussion presents selected information for
Siemens for the fiscal year ended September , :
Orders and revenue
In fiscal , revenue declined % year-over-year, to €.
billion, while orders rose % compared to the prior-year period,
to €. billion. This resulted in a book-to-bill ratio of .. On
an organic basis, excluding the net effect of currency transla-
tion and portfolio transactions, revenue decreased %, while
orders came in % above fiscal . Within the full-year trend,
the development of orders and revenue was strongly influ-
enced by the recovery in the global economy. While order in-
take fell % year-over-year for the first six months, we reported
order growth of % for the second half of fiscal com-
pared to the prior-year period. Revenue development followed
a similar pattern through the year, though with less pro-
nounced fluctuations due to the stabilizing effect of our strong
order backlog. The total order backlog for our Sectors was €
billion as of September , , up from € billion a year
earlier, including positive currency translation effects. Out of
the current backlog, orders of € billion are expected to be
converted into revenue during fiscal , orders of € billion
during , and the remainder in the periods thereafter.
Orders related to external customers increased % in fiscal
on higher demand in Industry and Healthcare, and in-
cluding positive currency translation effects in all Sectors. The
Industry Sector – our largest Sector by revenue – saw orders
rise % on growth in five of its six Divisions, led by double-
digit increases at Industry Automation and OSRAM. Orders at
Mobility came in lower year-over-year, due primarily to a lower
volume from major orders. Order intake in the Energy Sector
came in level with the prior-year period, as lower orders at Fos-
sil Power Generation were offset by growth in the other Divi-
sions of the Sector, led by higher demand at Renewable Energy.
The order decline at Fossil Power Generation was due primar-
ily to a lower volume from major orders in the first three quar-
ters of fiscal , a trend which reversed in the fourth quarter.
Order growth in the Healthcare Sector was driven by strong
order intake at Imaging & IT.
On a geographic basis, orders rose by double digits in the
Americas and also rose in Asia, Australia, more than offsetting
an order decline in Europe, C.I.S., Africa, Middle East. Order
development in emerging markets, as these markets are de-
fined by the Inter national Monetary Fund, was consistent with
the overall order trend in each of our three reporting regions.
In
Europe, C.I.S., Africa, Middle East
– our largest reporting
region by revenue – orders fell %, largely due to a decline in
the Energy Sector, where orders were % lower year-over-year.
This was largely the result of a lower volume from major orders
at Fossil Power Generation. Healthcare orders remained stable
in the region and Industry orders came in % above the prior-
year period, as growth at Drive Technologies, Industry Auto-
mation and OSRAM more than offset lower demand at other
Divisions, including a lower volume from major orders at Mo-
bility. Large prior-year contract wins at Mobility were the pri-
mary factor in a % order decline for Siemens in Germany. In
the Americas, orders rose % on double-digit growth in all
Sectors. The largest increase was a % rise in the Energy Sec-
tor, driven by a number of large onshore wind-farm orders at
Renewable Energy. Industry orders rose % in the region, with
contributions from all Divisions. Healthcare reported a %
order increase in the Americas, due primarily to strong demand
at Imaging & IT. Within the region, order growth in the U.S.
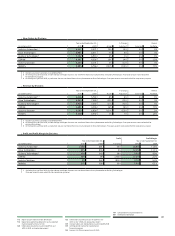
New Orders (location of customer)
Year ended September , % Change vs. previous year therein
(in millions of €) Actual Adjusted Currency Portfolio
Europe, C.I.S., Africa, Middle East 43,478 45,696 (5)% (5)% 1% (1)%
therein Germany 11,985 12,307 (3)% (2)% 0% 0%
Americas 23,454 19,935 18% 15% 3% 0%
therein U.S. 16,640 14,691 13% 12% 2% 0%
Asia, Australia 14,231 13,360 7% 2% 5% 0%
therein China 5,599 5,525 1% 0% 2% 0%
therein India 2,368 2,309 3% (2)% 4% 0%
Siemens 81,163 78,991 3% 1% 2% (1)%
1 Excluding currency translation and portfolio effects. 2 Commonwealth of Independent States