Siemens 2010 Annual Report Download - page 240
Download and view the complete annual report
Please find page 240 of the 2010 Siemens annual report below. You can navigate through the pages in the report by either clicking on the pages listed below, or by using the keyword search tool below to find specific information within the annual report.-
 1
1 -
2
-
3
-
4
-
5
-
6
-
7
-
8
-
9
-
10
-
11
-
12
-
13
-
14
-
15
-
16
-
17
-
18
-
19
-
20
-
21
-
22
-
23
-
24
-
25
-
26
-
27
-
28
-
29
-
30
-
31
-
32
-
33
-
34
-
35
-
36
-
37
-
38
-
39
-
40
-
41
-
42
-
43
-
44
-
45
-
46
-
47
-
48
-
49
-
50
-
51
-
52
-
53
-
54
-
55
-
56
-
57
-
58
-
59
-
60
-
61
-
62
-
63
-
64
-
65
-
66
-
67
-
68
-
69
-
70
-
71
-
72
-
73
-
74
-
75
-
76
-
77
-
78
-
79
-
80
-
81
-
82
-
83
-
84
-
85
-
86
-
87
-
88
-
89
-
90
-
91
-
92
-
93
-
94
-
95
-
96
-
97
-
98
-
99
-
100
-
101
-
102
-
103
-
104
-
105
-
106
-
107
-
108
-
109
-
110
-
111
-
112
-
113
-
114
-
115
-
116
-
117
-
118
-
119
-
120
-
121
-
122
-
123
-
124
-
125
-
126
-
127
-
128
-
129
-
130
-
131
-
132
-
133
-
134
-
135
-
136
-
137
-
138
-
139
-
140
-
141
-
142
-
143
-
144
-
145
-
146
-
147
-
148
-
149
-
150
-
151
-
152
-
153
-
154
-
155
-
156
-
157
-
158
-
159
-
160
-
161
-
162
-
163
-
164
-
165
-
166
-
167
-
168
-
169
-
170
-
171
-
172
-
173
-
174
-
175
-
176
-
177
-
178
-
179
-
180
-
181
-
182
-
183
-
184
-
185
-
186
-
187
-
188
-
189
-
190
-
191
-
192
-
193
-
194
-
195
-
196
-
197
-
198
-
199
-
200
-
201
-
202
-
203
-
204
-
205
-
206
-
207
-
208
-
209
-
210
-
211
-
212
-
213
-
214
-
215
-
216
-
217
-
218
-
219
-
220
-
221
-
222
-
223
-
224
-
225
-
226
-
227
-
228
-
229
-
 230
230 -
 231
231 -
 232
232 -
 233
233 -
 234
234 -
 235
235 -
 236
236 -
 237
237 -
 238
238 -
 239
239 -
 240
240 -
 241
241 -
 242
242 -
 243
243 -
 244
244 -
 245
245 -
 246
246 -
 247
247 -
 248
248 -
 249
249 -
 250
250 -
251
-
252
-
253
-
254
-
255
-
256
-
257
-
258
-
259
-
260
-
261
-
262
-
263
-
264
-
265
-
266
-
267
-
268
-
269
-
270
-
271
-
272
-
273
-
274
-
275
-
276
-
277
-
278
-
279
-
280
-
281
-
282
-
283
-
284
-
285
-
286
-
287
-
288
-
289
-
290
-
291
-
292
-
293
-
294
-
295
-
296
-
297
-
298
-
299
-
300
-
301
-
302
-
303
-
304
-
305
-
306
-
307
-
308
-
309
-
310
-
311
-
312
-
313
-
314
-
315
-
316
-
317
-
318
-
319
-
320
-
321
-
322
-
323
-
324
-
325
-
326
-
327
-
328
-
329
-
330
-
331
-
332
-
333
-
334
-
335
-
336
-
337
-
338
-
339
-
340
-
341
-
342
-
343
-
344
 |
 |

6 To our shareholders 21 Corporate Governance 49 Combined management’s discussion and analysis
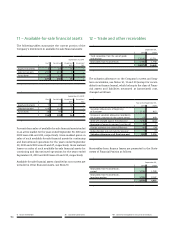
– Available-for-sale financial assets
The following tables summarize the current portion of the
Company ’s investment in available-for-sale financial assets:
September ,
Cost Fair Value Unrealized
gain
Unrealized
loss
Equity instruments 6 22 16 –
Debt instruments 210 213 3 –
Fund shares 11 11 – –
227 246 19 –
September ,
Cost Fair Value Unrealized
gain
Unrealized
loss
Equity instruments 7 19 12 –
Debt instruments 109 112 3 –
Fund shares 38 39 1 –
154 170 16 –
Proceeds from sales of available-for-sale financial assets traded
in an active market for the years ended September , and
were € and €, respectively. Gross realized gains on
sales of such available-for-sale financial assets for continuing
and discontinued operations for the years ended September
, and were € and €, respectively. Gross realized
losses on sales of such available-for-sale financial assets for
continuing and discontinued operations for the years ended
September , and were € and €, respectively.
Available-for-sale financial assets classified as non-current are
included in Other financial assets, see Note .
– Trade and other receivables
September ,
Trade receivables from the sale of goods
and services 13,186 12,711
Receivables from finance leases 1,785 1,738
14,971 14,449
The valuation allowance on the Company ’s current and long-
term receivables, see Notes , and (except for receiv-
ables from finance leases), which belong to the class of Finan-
cial assets and liabilities measured at (amortized) cost,
changed as follows:
Year ended September ,
Valuation allowance as of beginning
of fiscal year 1,116 913
Increase in valuation allowances recorded in
the income statement in the current period 63 449
Write-offs charged against the allowance (240) (222)
Recoveries of amounts previously written-off 13 7
Foreign exchange translation differences 40 (24)
Reclassification to Assets held for disposal 1 (7)
Valuation allowance as of fiscal year-end 993 1,116
Receivables from finance leases are presented in the State-
ments of Financial Position as follows:
September ,
Receivables from finance leases,
current 1,785 1,738
Receivables from finance leases,
long-term portion 3,094 3,147
4,879 4,885