Siemens 2010 Annual Report Download - page 2
Download and view the complete annual report
Please find page 2 of the 2010 Siemens annual report below. You can navigate through the pages in the report by either clicking on the pages listed below, or by using the keyword search tool below to find specific information within the annual report.-
 1
1 -
 2
2 -
 3
3 -
 4
4 -
 5
5 -
 6
6 -
 7
7 -
 8
8 -
 9
9 -
 10
10 -
 11
11 -
 12
12 -
 13
13 -
14
-
15
-
16
-
17
-
18
-
19
-
20
-
21
-
22
-
23
-
24
-
25
-
26
-
27
-
28
-
29
-
30
-
31
-
32
-
33
-
34
-
35
-
36
-
37
-
38
-
39
-
40
-
41
-
42
-
43
-
44
-
45
-
46
-
47
-
48
-
49
-
50
-
51
-
52
-
53
-
54
-
55
-
56
-
57
-
58
-
59
-
60
-
61
-
62
-
63
-
64
-
65
-
66
-
67
-
68
-
69
-
70
-
71
-
72
-
73
-
74
-
75
-
76
-
77
-
78
-
79
-
80
-
81
-
82
-
83
-
84
-
85
-
86
-
87
-
88
-
89
-
90
-
91
-
92
-
93
-
94
-
95
-
96
-
97
-
98
-
99
-
100
-
101
-
102
-
103
-
104
-
105
-
106
-
107
-
108
-
109
-
110
-
111
-
112
-
113
-
114
-
115
-
116
-
117
-
118
-
119
-
120
-
121
-
122
-
123
-
124
-
125
-
126
-
127
-
128
-
129
-
130
-
131
-
132
-
133
-
134
-
135
-
136
-
137
-
138
-
139
-
140
-
141
-
142
-
143
-
144
-
145
-
146
-
147
-
148
-
149
-
150
-
151
-
152
-
153
-
154
-
155
-
156
-
157
-
158
-
159
-
160
-
161
-
162
-
163
-
164
-
165
-
166
-
167
-
168
-
169
-
170
-
171
-
172
-
173
-
174
-
175
-
176
-
177
-
178
-
179
-
180
-
181
-
182
-
183
-
184
-
185
-
186
-
187
-
188
-
189
-
190
-
191
-
192
-
193
-
194
-
195
-
196
-
197
-
198
-
199
-
200
-
201
-
202
-
203
-
204
-
205
-
206
-
207
-
208
-
209
-
210
-
211
-
212
-
213
-
214
-
215
-
216
-
217
-
218
-
219
-
220
-
221
-
222
-
223
-
224
-
225
-
226
-
227
-
228
-
229
-
230
-
231
-
232
-
233
-
234
-
235
-
236
-
237
-
238
-
239
-
240
-
241
-
242
-
243
-
244
-
245
-
246
-
247
-
248
-
249
-
250
-
251
-
252
-
253
-
254
-
255
-
256
-
257
-
258
-
259
-
260
-
261
-
262
-
263
-
264
-
265
-
266
-
267
-
268
-
269
-
270
-
271
-
272
-
273
-
274
-
275
-
276
-
277
-
278
-
279
-
280
-
281
-
282
-
283
-
284
-
285
-
286
-
287
-
288
-
289
-
290
-
291
-
292
-
293
-
294
-
295
-
296
-
297
-
298
-
299
-
300
-
301
-
302
-
303
-
304
-
305
-
306
-
307
-
308
-
309
-
310
-
311
-
312
-
313
-
314
-
315
-
316
-
317
-
318
-
319
-
320
-
321
-
322
-
323
-
324
-
325
-
326
-
327
-
328
-
329
-
330
-
331
-
332
-
333
-
334
-
335
-
336
-
337
-
338
-
339
-
340
-
341
-
342
-
343
-
344
 |
 |

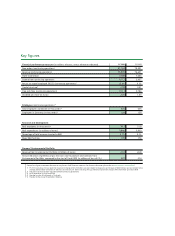
Key figures
Financial performance measures (in millions of euros, unless otherwise indicated) FY FY
New orders (continuing operations) 81,163 78,991
Revenue (continuing operations) 75,978 76,651
Profit Total Sectors 7,789 7,466
Income from continuing operations 4,112 2,457
Return on capital employed (ROCE) (continuing operations)
10.4% 6.1%
Capital structure
0.08 0.31
Free cash flow (continuing operations) 7,111 3,786
Dividend per share (in euros) 2.70 51.60
Employees (continuing operations)
Total employees worldwide (in thousands)
405 405
Employees in Germany (in thousands)
128 128
Research and development
R&D employees (in thousands)
30.1 31.8
R&D expenditures (in millions of euros) 3,846 3,900
Percentage of total revenue invested in R&D 5.1% 5.1%
Major R&D facilities 178 176
Siemens’ Environmental Portfolio
Revenue from Environmental Portfolio (in billions of euros) 27.6 26.8
Annual reduction of greenhouse gas emissions due to products and solutions from
Environmental Portfolio, compared to the start of fiscal (in millions of tons of CO)267 214
Some of the figures mentioned above are or may be non-GAAP financial measures. For further information please refer to www.siemens.com/nonGAAP.
1 FY 2010: including (3.6) pp related to impairment charges of €1.204 billion (pre-tax) related to Diagnostics and charges of €460 million (pre-tax) related to the
strategic reorientation of Siemens IT Solutions and Services; FY 2009: including (4.6) pp related to impairment charges of €1.850 billion (pre-tax) at NSN
2 Adjusted industrial net debt / adjusted EBITDA (continuing operations)
3 As of September 30, and
4 Average number of employees in fiscal year
5 Proposal to the Annual Shareholders’ Meeting