Siemens 2010 Annual Report Download - page 159
Download and view the complete annual report
Please find page 159 of the 2010 Siemens annual report below. You can navigate through the pages in the report by either clicking on the pages listed below, or by using the keyword search tool below to find specific information within the annual report.-
 1
1 -
2
-
3
-
4
-
5
-
6
-
7
-
8
-
9
-
10
-
11
-
12
-
13
-
14
-
15
-
16
-
17
-
18
-
19
-
20
-
21
-
22
-
23
-
24
-
25
-
26
-
27
-
28
-
29
-
30
-
31
-
32
-
33
-
34
-
35
-
36
-
37
-
38
-
39
-
40
-
41
-
42
-
43
-
44
-
45
-
46
-
47
-
48
-
49
-
50
-
51
-
52
-
53
-
54
-
55
-
56
-
57
-
58
-
59
-
60
-
61
-
62
-
63
-
64
-
65
-
66
-
67
-
68
-
69
-
70
-
71
-
72
-
73
-
74
-
75
-
76
-
77
-
78
-
79
-
80
-
81
-
82
-
83
-
84
-
85
-
86
-
87
-
88
-
89
-
90
-
91
-
92
-
93
-
94
-
95
-
96
-
97
-
98
-
99
-
100
-
101
-
102
-
103
-
104
-
105
-
106
-
107
-
108
-
109
-
110
-
111
-
112
-
113
-
114
-
115
-
116
-
117
-
118
-
119
-
120
-
121
-
122
-
123
-
124
-
125
-
126
-
127
-
128
-
129
-
130
-
131
-
132
-
133
-
134
-
135
-
136
-
137
-
138
-
139
-
140
-
141
-
142
-
143
-
144
-
145
-
146
-
147
-
148
-
 149
149 -
 150
150 -
 151
151 -
 152
152 -
 153
153 -
 154
154 -
 155
155 -
 156
156 -
 157
157 -
 158
158 -
 159
159 -
 160
160 -
 161
161 -
 162
162 -
 163
163 -
 164
164 -
 165
165 -
 166
166 -
 167
167 -
 168
168 -
 169
169 -
170
-
171
-
172
-
173
-
174
-
175
-
176
-
177
-
178
-
179
-
180
-
181
-
182
-
183
-
184
-
185
-
186
-
187
-
188
-
189
-
190
-
191
-
192
-
193
-
194
-
195
-
196
-
197
-
198
-
199
-
200
-
201
-
202
-
203
-
204
-
205
-
206
-
207
-
208
-
209
-
210
-
211
-
212
-
213
-
214
-
215
-
216
-
217
-
218
-
219
-
220
-
221
-
222
-
223
-
224
-
225
-
226
-
227
-
228
-
229
-
230
-
231
-
232
-
233
-
234
-
235
-
236
-
237
-
238
-
239
-
240
-
241
-
242
-
243
-
244
-
245
-
246
-
247
-
248
-
249
-
250
-
251
-
252
-
253
-
254
-
255
-
256
-
257
-
258
-
259
-
260
-
261
-
262
-
263
-
264
-
265
-
266
-
267
-
268
-
269
-
270
-
271
-
272
-
273
-
274
-
275
-
276
-
277
-
278
-
279
-
280
-
281
-
282
-
283
-
284
-
285
-
286
-
287
-
288
-
289
-
290
-
291
-
292
-
293
-
294
-
295
-
296
-
297
-
298
-
299
-
300
-
301
-
302
-
303
-
304
-
305
-
306
-
307
-
308
-
309
-
310
-
311
-
312
-
313
-
314
-
315
-
316
-
317
-
318
-
319
-
320
-
321
-
322
-
323
-
324
-
325
-
326
-
327
-
328
-
329
-
330
-
331
-
332
-
333
-
334
-
335
-
336
-
337
-
338
-
339
-
340
-
341
-
342
-
343
-
344
 |
 |

113 Report on post-balance sheet date events
114 Report on expected developments and associated
material opportunities and risks
128 Information required pursuant to § () and
§ () HGB and explanatory report
133 Information required pursuant to § () and
§ () no. HGB and explanatory report
135 Compensation and declaration pursuant to §a HGB
135 Additional information for supplemental
financial measures
138 Siemens AG (Discussion on basis of HGB)
147 Consolidated Financial Statements
261 Additional information
the Division recorded € million of integration costs. A year
earlier, PPA effects and integration costs totaled € million.
Fiscal orders and revenue rose % year-over-year, benefit-
ing strongly from positive currency translation effects. On a
geographic basis, revenue and order growth in the Americas
and Asia, Australia more than offset slight declines in Europe,
C.I.S., Africa, Middle East. On an organic basis, orders and
revenue rose % and %, respectively, compared to the prior-
year levels.
Equity Investments
In fiscal , Equity Investments recorded a loss of € mil-
lion compared to a loss of €. billion a year earlier. The dif-
ference is due mainly to a significantly higher loss related to
our stake in Nokia Siemens Networks B.V. (NSN) in the prior
fiscal year. In fiscal , we took an impairment of €. bil-
lion on our investment in NSN. The prior-year loss from our
stake in NSN also included a charge of € million related to
an impairment of deferred tax assets at NSN. Furthermore,
NSN took restructuring charges and incurred integration costs
of € million. These factors led to an equity investment loss
related to our stake in NSN of €. billion in fiscal . Also
in fiscal Enterprise Networks Holdings B.V. (EN) incurred
an operating loss and took restructuring charges. As a result,
we incurred a loss of € million from our investment in EN in
the prior fiscal year. These losses were only partly offset by a
gain of € million from the sale of our stake in FSC as well as
equity investment income of € million related to our stakes
in BSH Bosch und Siemens Hausgeräte GmbH (BSH) and
Krauss-Maffei Wegmann GmbH & Co. KG (KMW). For compari-
son, in fiscal , the loss related to our stake in NSN was
€ million. NSN recorded restructuring charges and integra-
tion costs of € million in the current fiscal year. Also in fiscal
, Equity investment income from our stakes in BSH and KMW
improved to a total of € million. Siemens’ results from Equity
Investments are expected to be volatile in coming quarters.
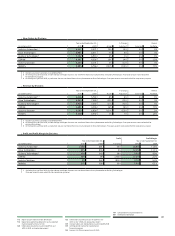
Year ended September , % Change therein
(in millions of €) Actual Adjusted Currency Portfolio
Profit (537) 90 –
Profit margin (12.9)% 1.9%
New orders 4,226 4,501 (6)% (7)% 1% 0%
Total revenue 4,155 4,686 (11)% (12)% 1% 0%
External revenue 3,150 3,580 (12)%
therein:
Europe, C.I.S., Africa, Middle East 2,725 3,129 (13)%
therein Germany 1,118 1,307 (14)%
Americas 366 399 (8)%
Asia, Australia 59 52 13%
1 Excluding currency translation and portfolio effects. 2 Commonwealth of Independent States
Cross-Sector Businesses
Siemens IT Solutions and Services
In fiscal , Siemens IT Solutions and Services faced opera-
tional challenges while operating in a highly competitive envi-
ronment. As a result, orders and revenue declined % and %,
respectively compared to fiscal and profit turned nega-
tive. The loss of € million was primarily due to charges of
€ million related to the completion of previously an-
nounced staff reduction measures related to a strategic reori-
entation aimed at strengthening the competitive position of
the business. For further information see “Business and operat-
ing environment – Strategy – Segment strategies.” Charges for
staff reduction measures in fiscal were € million. Profit
in both fiscal years was also burdened by project related
charges, which were significantly higher in the current fiscal
year. As of October , , Siemens IT Solutions and Services
was carved out of Siemens AG as a separate legal entity which
is a wholly owned, consolidated subsidiary of Siemens AG. For
further information on charges related to the strategic reorien-
tation of Siemens IT Solutions and Services see “– Reconcilia-
tion to Consolidated Financial Statements – Corporate items
and pensions.”