Siemens 2010 Annual Report Download - page 263
Download and view the complete annual report
Please find page 263 of the 2010 Siemens annual report below. You can navigate through the pages in the report by either clicking on the pages listed below, or by using the keyword search tool below to find specific information within the annual report.-
 1
1 -
2
-
3
-
4
-
5
-
6
-
7
-
8
-
9
-
10
-
11
-
12
-
13
-
14
-
15
-
16
-
17
-
18
-
19
-
20
-
21
-
22
-
23
-
24
-
25
-
26
-
27
-
28
-
29
-
30
-
31
-
32
-
33
-
34
-
35
-
36
-
37
-
38
-
39
-
40
-
41
-
42
-
43
-
44
-
45
-
46
-
47
-
48
-
49
-
50
-
51
-
52
-
53
-
54
-
55
-
56
-
57
-
58
-
59
-
60
-
61
-
62
-
63
-
64
-
65
-
66
-
67
-
68
-
69
-
70
-
71
-
72
-
73
-
74
-
75
-
76
-
77
-
78
-
79
-
80
-
81
-
82
-
83
-
84
-
85
-
86
-
87
-
88
-
89
-
90
-
91
-
92
-
93
-
94
-
95
-
96
-
97
-
98
-
99
-
100
-
101
-
102
-
103
-
104
-
105
-
106
-
107
-
108
-
109
-
110
-
111
-
112
-
113
-
114
-
115
-
116
-
117
-
118
-
119
-
120
-
121
-
122
-
123
-
124
-
125
-
126
-
127
-
128
-
129
-
130
-
131
-
132
-
133
-
134
-
135
-
136
-
137
-
138
-
139
-
140
-
141
-
142
-
143
-
144
-
145
-
146
-
147
-
148
-
149
-
150
-
151
-
152
-
153
-
154
-
155
-
156
-
157
-
158
-
159
-
160
-
161
-
162
-
163
-
164
-
165
-
166
-
167
-
168
-
169
-
170
-
171
-
172
-
173
-
174
-
175
-
176
-
177
-
178
-
179
-
180
-
181
-
182
-
183
-
184
-
185
-
186
-
187
-
188
-
189
-
190
-
191
-
192
-
193
-
194
-
195
-
196
-
197
-
198
-
199
-
200
-
201
-
202
-
203
-
204
-
205
-
206
-
207
-
208
-
209
-
210
-
211
-
212
-
213
-
214
-
215
-
216
-
217
-
218
-
219
-
220
-
221
-
222
-
223
-
224
-
225
-
226
-
227
-
228
-
229
-
230
-
231
-
232
-
233
-
234
-
235
-
236
-
237
-
238
-
239
-
240
-
241
-
242
-
243
-
244
-
245
-
246
-
247
-
248
-
249
-
250
-
251
-
252
-
 253
253 -
 254
254 -
 255
255 -
 256
256 -
 257
257 -
 258
258 -
 259
259 -
 260
260 -
 261
261 -
 262
262 -
 263
263 -
 264
264 -
 265
265 -
 266
266 -
 267
267 -
 268
268 -
 269
269 -
 270
270 -
 271
271 -
 272
272 -
 273
273 -
274
-
275
-
276
-
277
-
278
-
279
-
280
-
281
-
282
-
283
-
284
-
285
-
286
-
287
-
288
-
289
-
290
-
291
-
292
-
293
-
294
-
295
-
296
-
297
-
298
-
299
-
300
-
301
-
302
-
303
-
304
-
305
-
306
-
307
-
308
-
309
-
310
-
311
-
312
-
313
-
314
-
315
-
316
-
317
-
318
-
319
-
320
-
321
-
322
-
323
-
324
-
325
-
326
-
327
-
328
-
329
-
330
-
331
-
332
-
333
-
334
-
335
-
336
-
337
-
338
-
339
-
340
-
341
-
342
-
343
-
344
 |
 |

147 Consolidated Financial Statements
148 Consolidated Statements of Income
149 Consolidated Statements of Comprehensive Income
150 Consolidated Statements of Financial Position
151 Consolidated Statements of Cash Flow
152 Consolidated Statements of Changes in Equity
154 Notes to Consolidated Financial Statements
(in millions of €, except where otherwise stated
and per share amounts)
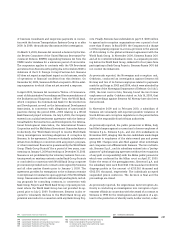
261 Additional information
Other post-employment benefits: Assumptions
used in the calculation of the DBO and NPBC
Discount rates and other key assumptions used for transition
payments in Germany are the same as those utilized for do-
mestic pension benefit plans.
The weighted-average assumptions used in calculating the
actuarial values for the post-employment healthcare and life
insurance benefits are as follows:
Year ended
Sept. ,
Year ended
Sept. ,
Discount rate 4.81% 5.66%
U.S.:
Medical trend rates
(initial / ultimate / year):
Medicare ineligible pre- 8.0% / 5% / 2017 8.5% / 5% / 2017
Medicare eligible post- 8.5% / 5% / 2018 9% / 5% / 2018
Dental trend rates
(initial / ultimate / year) 6% / 5% / 2021 6% / 5% / 2021
Canada:
Medical trend rates 5.00% 5.00%
Drug trend rates 5% 7% / 5% / 2010
Dental trend rates 4.00% 4.00%
Experience adjustments, which result from differences be-
tween the actuarial assumptions and the actual occurrence,
increased the DBO by . percent in fiscal and decreased
the DBO by . percent, . percent, . percent and . percent
in fiscal , , and , respectively.
Other post-employment benefits: Sensitivity analysis
The health care assumptions may be significantly influenced
by the expected progression in health care expense. A one-
percentage-point change in the healthcare trend rates would
have resulted in the following increase (decrease) of the de-
fined benefit obligation and the service and interest cost as of
and for the year ended September , :
September ,
One-percentage-point
increase decrease
Effect on defined benefit obligation 17 (14)
Effect on total of service and
interest cost components 1 (1)
Other post-employment benefits: Benefit payments
The following overview comprises benefit payments for other
post-employment benefits paid out of the principal other de-
fined benefit post-employment plans during the years ended
September , and , and expected pension payments
for the next five years and in the aggregate for the five years
thereafter (undiscounted):
Total Domestic Foreign
Payments for other
post-employment benefits
2009 61 34 27
2010 57 30 27
Expected payments for other
post-employment benefits
2011 66 38 28
2012 57 29 28
2013 53 25 28
2014 58 31 27
2015 65 37 28
2016 – 2020 342 203 139
Since the benefit obligations for other post-employment ben-
efits are generally not funded, such payments will impact the
current operating cash flow of the Company.