Siemens 2010 Annual Report Download - page 157
Download and view the complete annual report
Please find page 157 of the 2010 Siemens annual report below. You can navigate through the pages in the report by either clicking on the pages listed below, or by using the keyword search tool below to find specific information within the annual report.-
 1
1 -
2
-
3
-
4
-
5
-
6
-
7
-
8
-
9
-
10
-
11
-
12
-
13
-
14
-
15
-
16
-
17
-
18
-
19
-
20
-
21
-
22
-
23
-
24
-
25
-
26
-
27
-
28
-
29
-
30
-
31
-
32
-
33
-
34
-
35
-
36
-
37
-
38
-
39
-
40
-
41
-
42
-
43
-
44
-
45
-
46
-
47
-
48
-
49
-
50
-
51
-
52
-
53
-
54
-
55
-
56
-
57
-
58
-
59
-
60
-
61
-
62
-
63
-
64
-
65
-
66
-
67
-
68
-
69
-
70
-
71
-
72
-
73
-
74
-
75
-
76
-
77
-
78
-
79
-
80
-
81
-
82
-
83
-
84
-
85
-
86
-
87
-
88
-
89
-
90
-
91
-
92
-
93
-
94
-
95
-
96
-
97
-
98
-
99
-
100
-
101
-
102
-
103
-
104
-
105
-
106
-
107
-
108
-
109
-
110
-
111
-
112
-
113
-
114
-
115
-
116
-
117
-
118
-
119
-
120
-
121
-
122
-
123
-
124
-
125
-
126
-
127
-
128
-
129
-
130
-
131
-
132
-
133
-
134
-
135
-
136
-
137
-
138
-
139
-
140
-
141
-
142
-
143
-
144
-
145
-
146
-
 147
147 -
 148
148 -
 149
149 -
 150
150 -
 151
151 -
 152
152 -
 153
153 -
 154
154 -
 155
155 -
 156
156 -
 157
157 -
 158
158 -
 159
159 -
 160
160 -
 161
161 -
 162
162 -
 163
163 -
 164
164 -
 165
165 -
 166
166 -
 167
167 -
168
-
169
-
170
-
171
-
172
-
173
-
174
-
175
-
176
-
177
-
178
-
179
-
180
-
181
-
182
-
183
-
184
-
185
-
186
-
187
-
188
-
189
-
190
-
191
-
192
-
193
-
194
-
195
-
196
-
197
-
198
-
199
-
200
-
201
-
202
-
203
-
204
-
205
-
206
-
207
-
208
-
209
-
210
-
211
-
212
-
213
-
214
-
215
-
216
-
217
-
218
-
219
-
220
-
221
-
222
-
223
-
224
-
225
-
226
-
227
-
228
-
229
-
230
-
231
-
232
-
233
-
234
-
235
-
236
-
237
-
238
-
239
-
240
-
241
-
242
-
243
-
244
-
245
-
246
-
247
-
248
-
249
-
250
-
251
-
252
-
253
-
254
-
255
-
256
-
257
-
258
-
259
-
260
-
261
-
262
-
263
-
264
-
265
-
266
-
267
-
268
-
269
-
270
-
271
-
272
-
273
-
274
-
275
-
276
-
277
-
278
-
279
-
280
-
281
-
282
-
283
-
284
-
285
-
286
-
287
-
288
-
289
-
290
-
291
-
292
-
293
-
294
-
295
-
296
-
297
-
298
-
299
-
300
-
301
-
302
-
303
-
304
-
305
-
306
-
307
-
308
-
309
-
310
-
311
-
312
-
313
-
314
-
315
-
316
-
317
-
318
-
319
-
320
-
321
-
322
-
323
-
324
-
325
-
326
-
327
-
328
-
329
-
330
-
331
-
332
-
333
-
334
-
335
-
336
-
337
-
338
-
339
-
340
-
341
-
342
-
343
-
344
 |
 |

113 Report on post-balance sheet date events
114 Report on expected developments and associated
material opportunities and risks
128 Information required pursuant to § () and
§ () HGB and explanatory report
133 Information required pursuant to § () and
§ () no. HGB and explanatory report
135 Compensation and declaration pursuant to §a HGB
135 Additional information for supplemental
financial measures
138 Siemens AG (Discussion on basis of HGB)
147 Consolidated Financial Statements
261 Additional information
out the year. Due to a particularly strong fourth quarter in the
transformers business, full-year revenue came in just below
the prior-year level. Orders at Power Transmission rose %
compared to the prior fiscal year, due to a higher volume from
major orders, including large contracts for grid access to off-
shore wind-farms.
Profit at Power Distribution was € million, down % from
the prior-year level, due mainly to a % decline in revenue.
Both results were driven by the Division’s medium voltage
business, which saw double-digit percentage drops in revenue
and profit compared to fiscal . Orders for the Division were
up % year-over-year, due to a strong fourth quarter that more
than offset weaker demand earlier in the fiscal year.
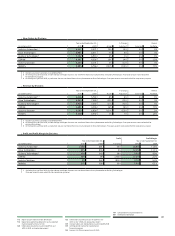
Healthcare
Sector
Year ended September , % Change therein
(in millions of €) Actual Adjusted Currency Portfolio
Profit 748 1,450 (48)%
Profit margin 6.1% 12.2%
New orders 12,872 11,950 8% 5% 3% 0%
Total revenue 12,364 11,927 4% 1% 3% 0%
External revenue 12,280 11,864 4%
therein:
Europe, C.I.S., Africa, Middle East 4,680 4,724 (1)%
therein Germany 1,056 1,072 (1)%
Americas 5,141 5,153 0%
Asia, Australia 2,459 1,986 24%
1 Excluding currency translation and portfolio effects. 2 Commonwealth of Independent States
Conditions in the global healthcare market improved in fiscal
, particularly including significant increases in healthcare
equipment spending in emerging markets. In addition, pas-
sage of healthcare reform legislation in the U.S. removed some
uncertainty in the market and contributed to an easing of cus-
tomer restraint regarding capital expenditures.
In fiscal , orders for the Healthcare Sector came in %
higher compared to the prior fiscal year. The Sector recorded
higher orders for Imaging & IT and Diagnostics in the Americas,
particularly including the U.S., and in Asia, Australia. Revenue
in fiscal increased % compared to fiscal , particu-
larly on a double-digit increase for all Divisions in Asia, Austra-
lia. Both orders and revenue were stable in Europe, C.I.S., Af-
rica, Middle East. On an organic basis, excluding strong posi-
tive currency translation effects, orders came in % higher and
revenue rose % compared to fiscal . Healthcare’s book-to-
bill ratio was . for fiscal , and its order backlog at the
end of the year stood at € billion compared to € billion a year
earlier. Of the Sector’s current backlog, orders of €. billion
are expected to be converted into revenue during fiscal ,
orders of €. billion during fiscal , and the remainder in
the periods thereafter.
Sector profit of € million in fiscal was burdened by
impairment charges of €. billion at Diagnostics during the
fourth quarter, including a goodwill impairment. These impair-
ments more than offset positive effects during the year. These
included a gain of € million related to the curtailment of pen-
sion plans in the U.S. and a gain of € million, taken at the
Sector level, as the Sector ceased to consolidate a subsidiary
due to loss of control. The change in profit year-over-year in-
cluded positive effects related to currency development, nota-
bly an unfavorable currency hedge in the prior year. Both years
under review include charges at Workflow & Solutions related
to particle therapy contracts. In fiscal , Diagnostics re-
corded € million in PPA effects related to past acquisitions.
A year earlier Diagnostics recorded a total of € million in
PPA and integration costs. In fiscal , the Sector recorded
€ million in costs for integrating activities at Diagnostics.