Siemens 2010 Annual Report Download - page 162
Download and view the complete annual report
Please find page 162 of the 2010 Siemens annual report below. You can navigate through the pages in the report by either clicking on the pages listed below, or by using the keyword search tool below to find specific information within the annual report.-
 1
1 -
2
-
3
-
4
-
5
-
6
-
7
-
8
-
9
-
10
-
11
-
12
-
13
-
14
-
15
-
16
-
17
-
18
-
19
-
20
-
21
-
22
-
23
-
24
-
25
-
26
-
27
-
28
-
29
-
30
-
31
-
32
-
33
-
34
-
35
-
36
-
37
-
38
-
39
-
40
-
41
-
42
-
43
-
44
-
45
-
46
-
47
-
48
-
49
-
50
-
51
-
52
-
53
-
54
-
55
-
56
-
57
-
58
-
59
-
60
-
61
-
62
-
63
-
64
-
65
-
66
-
67
-
68
-
69
-
70
-
71
-
72
-
73
-
74
-
75
-
76
-
77
-
78
-
79
-
80
-
81
-
82
-
83
-
84
-
85
-
86
-
87
-
88
-
89
-
90
-
91
-
92
-
93
-
94
-
95
-
96
-
97
-
98
-
99
-
100
-
101
-
102
-
103
-
104
-
105
-
106
-
107
-
108
-
109
-
110
-
111
-
112
-
113
-
114
-
115
-
116
-
117
-
118
-
119
-
120
-
121
-
122
-
123
-
124
-
125
-
126
-
127
-
128
-
129
-
130
-
131
-
132
-
133
-
134
-
135
-
136
-
137
-
138
-
139
-
140
-
141
-
142
-
143
-
144
-
145
-
146
-
147
-
148
-
149
-
150
-
151
-
 152
152 -
 153
153 -
 154
154 -
 155
155 -
 156
156 -
 157
157 -
 158
158 -
 159
159 -
 160
160 -
 161
161 -
 162
162 -
 163
163 -
 164
164 -
 165
165 -
 166
166 -
 167
167 -
 168
168 -
 169
169 -
 170
170 -
 171
171 -
 172
172 -
173
-
174
-
175
-
176
-
177
-
178
-
179
-
180
-
181
-
182
-
183
-
184
-
185
-
186
-
187
-
188
-
189
-
190
-
191
-
192
-
193
-
194
-
195
-
196
-
197
-
198
-
199
-
200
-
201
-
202
-
203
-
204
-
205
-
206
-
207
-
208
-
209
-
210
-
211
-
212
-
213
-
214
-
215
-
216
-
217
-
218
-
219
-
220
-
221
-
222
-
223
-
224
-
225
-
226
-
227
-
228
-
229
-
230
-
231
-
232
-
233
-
234
-
235
-
236
-
237
-
238
-
239
-
240
-
241
-
242
-
243
-
244
-
245
-
246
-
247
-
248
-
249
-
250
-
251
-
252
-
253
-
254
-
255
-
256
-
257
-
258
-
259
-
260
-
261
-
262
-
263
-
264
-
265
-
266
-
267
-
268
-
269
-
270
-
271
-
272
-
273
-
274
-
275
-
276
-
277
-
278
-
279
-
280
-
281
-
282
-
283
-
284
-
285
-
286
-
287
-
288
-
289
-
290
-
291
-
292
-
293
-
294
-
295
-
296
-
297
-
298
-
299
-
300
-
301
-
302
-
303
-
304
-
305
-
306
-
307
-
308
-
309
-
310
-
311
-
312
-
313
-
314
-
315
-
316
-
317
-
318
-
319
-
320
-
321
-
322
-
323
-
324
-
325
-
326
-
327
-
328
-
329
-
330
-
331
-
332
-
333
-
334
-
335
-
336
-
337
-
338
-
339
-
340
-
341
-
342
-
343
-
344
 |
 |

6 To our shareholders 21 Corporate Governance 49 Combined management’s discussion and analysis
50 Business and operating environment
78 Fiscal – Financial summary
81 Results of operations
98 Financial position
110 Net assets position
113 Overall assessment of the economic position
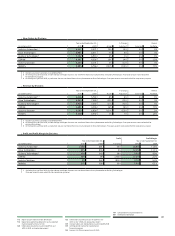
RECONCILIATION TO ADJUSTED EBITDA (continuing operations)
The following table gives additional information on topics included in Profit and Income before income taxes and provides a reconciliation
to adjusted EBITDA. We report adjusted EBIT and adjusted EBITDA as a performance measure. The closest comparable GAAP figure under
IFRS is Net income as reported in our “Consolidated Statements of Income.”
For further information regarding adjusted EBIT and adjusted EBITDA, please refer to the end of this Combined management report.
For the fiscal years ended September , and
Profit Income (loss) from
investments accounted
for using the equity
method, net
(in millions of €)
Sectors and Divisions
Industry Sector 3,478 2,701 5 1
Industry Automation 1,048 681 (2) (2)
Drive Technologies 855 836 (1) (2)
Building Technologies 456 340 7 4
OSRAM 569 89 (8) (2)
Industry Solutions 39 360 4 4
Mobility 513 390 5 (1)
Energy Sector 3,562 3,315 78 59
Fossil Power Generation 1,516 1,275 27 26
Renewable Energy 368 382 9 4
Oil & Gas 487 499 – –
Power Transmission 763 725 36 27
Power Distribution 422 435 6 2
Healthcare Sector 748 1,450 3 29
Imaging & IT 1,452 1,161 7 8
Workflow & Solutions 27 (53) – 10
Diagnostics (776) 338 (9) –
Total Sectors 7,789 7,466 86 89
Equity Investments (191) (1,851) (248) (2,160)
Cross-Sector Businesses
Siemens IT Solutions and Services (537) 90 20 26
Siemens Financial Services (SFS) 447 304 83 130
Reconciliation to Consolidated Financial Statements
Centrally managed portfolio activities (139) (371) – –
Siemens Real Estate (SRE) 250 341 – –
Corporate items and pensions (1,479) (1,715) – (4)
Eliminations, Corporate Treasury and other reconciling items (328) (373) 20 (27)
Siemens 5,811 3,891 (40) (1,946)
1 Profit of the Sectors and Divisions as well as of Equity Investments, Siemens IT Solutions and Services and Centrally managed portfolio activities is earnings before financing interest,
certain pension costs and income taxes. Certain other items not considered performance indicative by Management may be excluded. Profit of SFS and SRE is Income before income
taxes. Profit of Siemens is Income from continuing operations before income taxes. For a reconciliation of Income from continuing operations before income taxes to Net income see
Consolidated Statements of Income.
2 Includes impairments and reversals of impairments of investments accounted for using the equity method.
3 Includes impairment of non-current available-for-sale financial assets. For Siemens, Financial income (expense), net comprises Interest income, Interest expense and Other financial
income (expense), net as reported in the Consolidated Statements of Income.