Siemens 2010 Annual Report Download - page 242
Download and view the complete annual report
Please find page 242 of the 2010 Siemens annual report below. You can navigate through the pages in the report by either clicking on the pages listed below, or by using the keyword search tool below to find specific information within the annual report.-
 1
1 -
2
-
3
-
4
-
5
-
6
-
7
-
8
-
9
-
10
-
11
-
12
-
13
-
14
-
15
-
16
-
17
-
18
-
19
-
20
-
21
-
22
-
23
-
24
-
25
-
26
-
27
-
28
-
29
-
30
-
31
-
32
-
33
-
34
-
35
-
36
-
37
-
38
-
39
-
40
-
41
-
42
-
43
-
44
-
45
-
46
-
47
-
48
-
49
-
50
-
51
-
52
-
53
-
54
-
55
-
56
-
57
-
58
-
59
-
60
-
61
-
62
-
63
-
64
-
65
-
66
-
67
-
68
-
69
-
70
-
71
-
72
-
73
-
74
-
75
-
76
-
77
-
78
-
79
-
80
-
81
-
82
-
83
-
84
-
85
-
86
-
87
-
88
-
89
-
90
-
91
-
92
-
93
-
94
-
95
-
96
-
97
-
98
-
99
-
100
-
101
-
102
-
103
-
104
-
105
-
106
-
107
-
108
-
109
-
110
-
111
-
112
-
113
-
114
-
115
-
116
-
117
-
118
-
119
-
120
-
121
-
122
-
123
-
124
-
125
-
126
-
127
-
128
-
129
-
130
-
131
-
132
-
133
-
134
-
135
-
136
-
137
-
138
-
139
-
140
-
141
-
142
-
143
-
144
-
145
-
146
-
147
-
148
-
149
-
150
-
151
-
152
-
153
-
154
-
155
-
156
-
157
-
158
-
159
-
160
-
161
-
162
-
163
-
164
-
165
-
166
-
167
-
168
-
169
-
170
-
171
-
172
-
173
-
174
-
175
-
176
-
177
-
178
-
179
-
180
-
181
-
182
-
183
-
184
-
185
-
186
-
187
-
188
-
189
-
190
-
191
-
192
-
193
-
194
-
195
-
196
-
197
-
198
-
199
-
200
-
201
-
202
-
203
-
204
-
205
-
206
-
207
-
208
-
209
-
210
-
211
-
212
-
213
-
214
-
215
-
216
-
217
-
218
-
219
-
220
-
221
-
222
-
223
-
224
-
225
-
226
-
227
-
228
-
229
-
230
-
231
-
 232
232 -
 233
233 -
 234
234 -
 235
235 -
 236
236 -
 237
237 -
 238
238 -
 239
239 -
 240
240 -
 241
241 -
 242
242 -
 243
243 -
 244
244 -
 245
245 -
 246
246 -
 247
247 -
 248
248 -
 249
249 -
 250
250 -
 251
251 -
 252
252 -
253
-
254
-
255
-
256
-
257
-
258
-
259
-
260
-
261
-
262
-
263
-
264
-
265
-
266
-
267
-
268
-
269
-
270
-
271
-
272
-
273
-
274
-
275
-
276
-
277
-
278
-
279
-
280
-
281
-
282
-
283
-
284
-
285
-
286
-
287
-
288
-
289
-
290
-
291
-
292
-
293
-
294
-
295
-
296
-
297
-
298
-
299
-
300
-
301
-
302
-
303
-
304
-
305
-
306
-
307
-
308
-
309
-
310
-
311
-
312
-
313
-
314
-
315
-
316
-
317
-
318
-
319
-
320
-
321
-
322
-
323
-
324
-
325
-
326
-
327
-
328
-
329
-
330
-
331
-
332
-
333
-
334
-
335
-
336
-
337
-
338
-
339
-
340
-
341
-
342
-
343
-
344
 |
 |

6 To our shareholders 21 Corporate Governance 49 Combined management’s discussion and analysis
– Other current financial assets
September ,
Derivative financial instruments 949 782
Loans receivable 740 786
Other 921 839
2,610 2,407
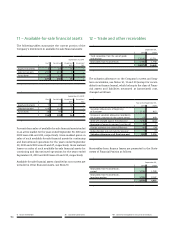
– Inventories
September ,
Raw materials and supplies 2,420 2,279
Work in process 3,724 3,619
Costs and earnings in excess of billings
on uncompleted contracts 7,538 7,137
Finished goods and products held for resale 2,866 2,945
Advances to suppliers 657 565
17,205 16,545
Advance payments received (2,255) (2,416)
14,950 14,129
Cost of goods sold and services rendered include inventories
recognized as an expense amounting to €, and €,,
respectively, in fiscal and . Raw materials and sup-
plies, work in process as well as finished goods and products
held for resale are valued at the lower of acquisition / produc-
tion cost and net realizable value. The respective write-downs,
as compared to prior year, increased by € (fiscal in-
crease by €).
Costs and earnings in excess of billings on uncompleted con-
tracts relates to construction contracts, with net asset balances
where contract costs plus recognized profits less recognized
losses exceed progress billings. Construction contracts, here
and as follows, include service contracts accounted for under
the percentage of completion method. Liabilities from con-
tracts for which progress billings exceed costs and recognized
profits less recognized losses are recognized in Other current
liabilities; see Note .
The aggregate amount of costs incurred and recognized profits
less recognized losses for construction contracts in progress,
as of September , and amounted to €, and
€,, respectively. Advance payments received on construc-
tion contracts in progress were €, and €, as of Sep-
tember , and . Revenue from construction con-
tracts amounted to €, and €,, respectively, for fiscal
and . Retentions in connection with construction
contracts were € and € in fiscal and . Informa-
tion concerning construction contracts does not include dis-
posal groups.
– Other current assets
September ,
Miscellaneous tax receivables 686 618
Prepaid expenses 296 317
Other 276 256
1,258 1,191