Siemens 2010 Annual Report Download - page 241
Download and view the complete annual report
Please find page 241 of the 2010 Siemens annual report below. You can navigate through the pages in the report by either clicking on the pages listed below, or by using the keyword search tool below to find specific information within the annual report.-
 1
1 -
2
-
3
-
4
-
5
-
6
-
7
-
8
-
9
-
10
-
11
-
12
-
13
-
14
-
15
-
16
-
17
-
18
-
19
-
20
-
21
-
22
-
23
-
24
-
25
-
26
-
27
-
28
-
29
-
30
-
31
-
32
-
33
-
34
-
35
-
36
-
37
-
38
-
39
-
40
-
41
-
42
-
43
-
44
-
45
-
46
-
47
-
48
-
49
-
50
-
51
-
52
-
53
-
54
-
55
-
56
-
57
-
58
-
59
-
60
-
61
-
62
-
63
-
64
-
65
-
66
-
67
-
68
-
69
-
70
-
71
-
72
-
73
-
74
-
75
-
76
-
77
-
78
-
79
-
80
-
81
-
82
-
83
-
84
-
85
-
86
-
87
-
88
-
89
-
90
-
91
-
92
-
93
-
94
-
95
-
96
-
97
-
98
-
99
-
100
-
101
-
102
-
103
-
104
-
105
-
106
-
107
-
108
-
109
-
110
-
111
-
112
-
113
-
114
-
115
-
116
-
117
-
118
-
119
-
120
-
121
-
122
-
123
-
124
-
125
-
126
-
127
-
128
-
129
-
130
-
131
-
132
-
133
-
134
-
135
-
136
-
137
-
138
-
139
-
140
-
141
-
142
-
143
-
144
-
145
-
146
-
147
-
148
-
149
-
150
-
151
-
152
-
153
-
154
-
155
-
156
-
157
-
158
-
159
-
160
-
161
-
162
-
163
-
164
-
165
-
166
-
167
-
168
-
169
-
170
-
171
-
172
-
173
-
174
-
175
-
176
-
177
-
178
-
179
-
180
-
181
-
182
-
183
-
184
-
185
-
186
-
187
-
188
-
189
-
190
-
191
-
192
-
193
-
194
-
195
-
196
-
197
-
198
-
199
-
200
-
201
-
202
-
203
-
204
-
205
-
206
-
207
-
208
-
209
-
210
-
211
-
212
-
213
-
214
-
215
-
216
-
217
-
218
-
219
-
220
-
221
-
222
-
223
-
224
-
225
-
226
-
227
-
228
-
229
-
230
-
 231
231 -
 232
232 -
 233
233 -
 234
234 -
 235
235 -
 236
236 -
 237
237 -
 238
238 -
 239
239 -
 240
240 -
 241
241 -
 242
242 -
 243
243 -
 244
244 -
 245
245 -
 246
246 -
 247
247 -
 248
248 -
 249
249 -
 250
250 -
 251
251 -
252
-
253
-
254
-
255
-
256
-
257
-
258
-
259
-
260
-
261
-
262
-
263
-
264
-
265
-
266
-
267
-
268
-
269
-
270
-
271
-
272
-
273
-
274
-
275
-
276
-
277
-
278
-
279
-
280
-
281
-
282
-
283
-
284
-
285
-
286
-
287
-
288
-
289
-
290
-
291
-
292
-
293
-
294
-
295
-
296
-
297
-
298
-
299
-
300
-
301
-
302
-
303
-
304
-
305
-
306
-
307
-
308
-
309
-
310
-
311
-
312
-
313
-
314
-
315
-
316
-
317
-
318
-
319
-
320
-
321
-
322
-
323
-
324
-
325
-
326
-
327
-
328
-
329
-
330
-
331
-
332
-
333
-
334
-
335
-
336
-
337
-
338
-
339
-
340
-
341
-
342
-
343
-
344
 |
 |

147 Consolidated Financial Statements
148 Consolidated Statements of Income
149 Consolidated Statements of Comprehensive Income
150 Consolidated Statements of Financial Position
151 Consolidated Statements of Cash Flow
152 Consolidated Statements of Changes in Equity
154 Notes to Consolidated Financial Statements
(in millions of €, except where otherwise stated
and per share amounts)
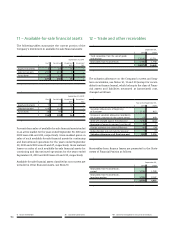
261 Additional information
The valuation allowance on the Company ’s current and long-
term receivables, see Notes and , relating to finance
leases, changed as follows:
Year ended September ,
Valuation allowance as of beginning
of fiscal year 165 100
Increase in valuation allowances recorded in
the income statement in the current period 45 148
Write-offs charged against the allowance (64) (97)
Recoveries of amounts previously written-off 15 18
Foreign exchange translation differences 7 (4)
Valuation allowance as of fiscal year-end 168 165
Minimum future lease payments to be received are as follows:
September ,
2010 – 2,084
2011 2,145 1,450
2012 1,428 978
2013 978 597
2014 541 280
2015 238 –
After in fiscal
(after in fiscal ) 168 173
Minimum future lease
payments to be received 5,498 5,562
The following table shows a reconciliation of minimum future
lease payments to the gross and net investment in leases and
to the present value of the minimum future lease payments
receivable:
September ,
Minimum future lease payments 5,498 5,562
Plus: Unguaranteed residual values 182 170
Gross investment in leases 5,680 5,732
Less: Unearned finance income (633) (682)
Net investment in leases 5,047 5,050
Less: Allowance for doubtful accounts (168) (165)
Less: Present value of unguaranteed
residual value (153) (144)
Present value of minimum
future lease payments receivable 4,726 4,741
The gross investment in leases and the present value of mini-
mum future lease payments receivable are due as follows:
September ,
Gross investment in leases 5,680 5,732
Within year 2,187 2,117
to years 3,308 3,420
Thereafter 185 195
Present value of minimum
future lease payments receivable 4,726 4,741
Within year 1,785 1,707
to years 2,790 2,881
Thereafter 151 153
Investments in finance leases primarily relate to equipment for
information technology and office machines, industrial ma-
chinery, medical equipment and transportation systems. Ac-
tual cash flows will vary from contractual maturities due to
future sales of finance receivables, prepayments and write-
offs.